[Question] No stupid questions - ask anything here
-
@Raimo-Järvi Make sense thanks.
Other question: how to make a pop-up like the multi-sport one when long pressing a button (progress ring, etc)? I saw the reference in documentation regarding the lock pop-up but it also lock the button which is not what I want. I want to use such pop-up as toggle for an option.
@suuntopartnerteam can you provide support on that? Thank you. -
@Thibault-B. You can catch long press with
onLongPressinpushButtonelement. And maybe Popup example in SuuntoPlus editor could work for toggling an option. But I don’t know how to get the progress ring. I don’t know if it’s part of the multi-sport popup, or if it’s generic functionality that can also be used elsewhere. In theory, you could catchonLongPressStartand implement your own progress ring view, but that would probably be difficult to implement. -
Can a CSS guru help me out?
I want to show the current speed in the center of the screen. This works fine without a postfix, but as soon as I add a postfix, the speed fields shifts slightly to the left because both <span> elements are centered together.
How do I center the first <span> element and put the postfix right of it?
<div class="sp-d-s p-hc" style="top:calc(87% - 50%e)"> <span> <eval input="/Activity/Current/Speed" outputFormat="{zapp_speed_format}" default="--" /> </span> <span class="cm-mid sp-t-s" style="padding-top:6px; padding-left:4px"> <postfix /> </span> </div> -
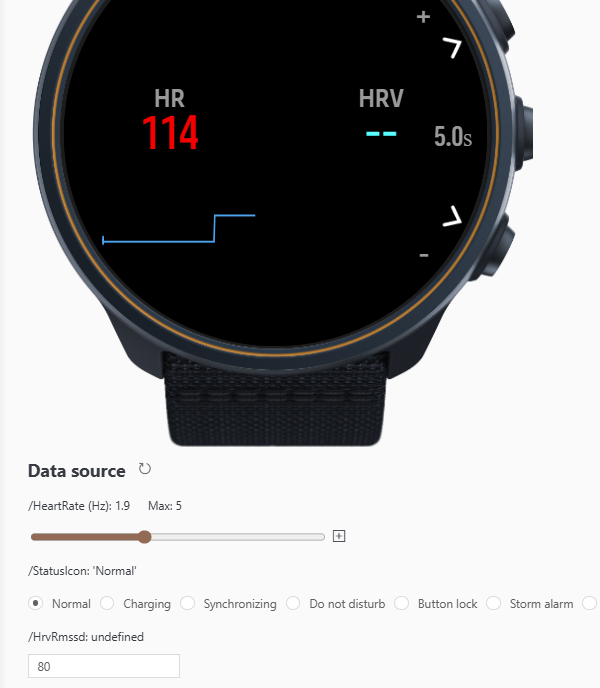
Hey guys, could someone make HRV reading work?
I do not get the values, even tough the Suunto Smart Belt is conencted.
In the SImulator it says “undefined” for /HrvRmssd
-
Hi guys!
Is there any solution to get the NGP values?
I tried two different syntaxes: /Activity/Move/-1/NormalizedGradedPace/Current and /Activity/Move/-1/NGP/Current but both are unrecognized.
Thanks a lot
-
I tried to investigate a bit more about my own question.
I’ve been able to find two files in SuuntoPlus Editor that are listing all the available ressources:- .vscode/extensions/suunto.suuntoplus-editor-1.42.0/node_modules/@suunto-internal/suuntoplus-tools/lib/project/resource-common.js <= for generic ressources, not depending on parameters <= big array
- .vscode/extensions/suunto.suuntoplus-editor-1.42.0/node_modules/@suunto-internal/suuntoplus-tools/lib/project/resource.js <= for parametric ressources <= multiple regexes, still readable
Can’t find anything related to NGP, so I might conclude this is not available?
-
Tried to develop my own data screen.
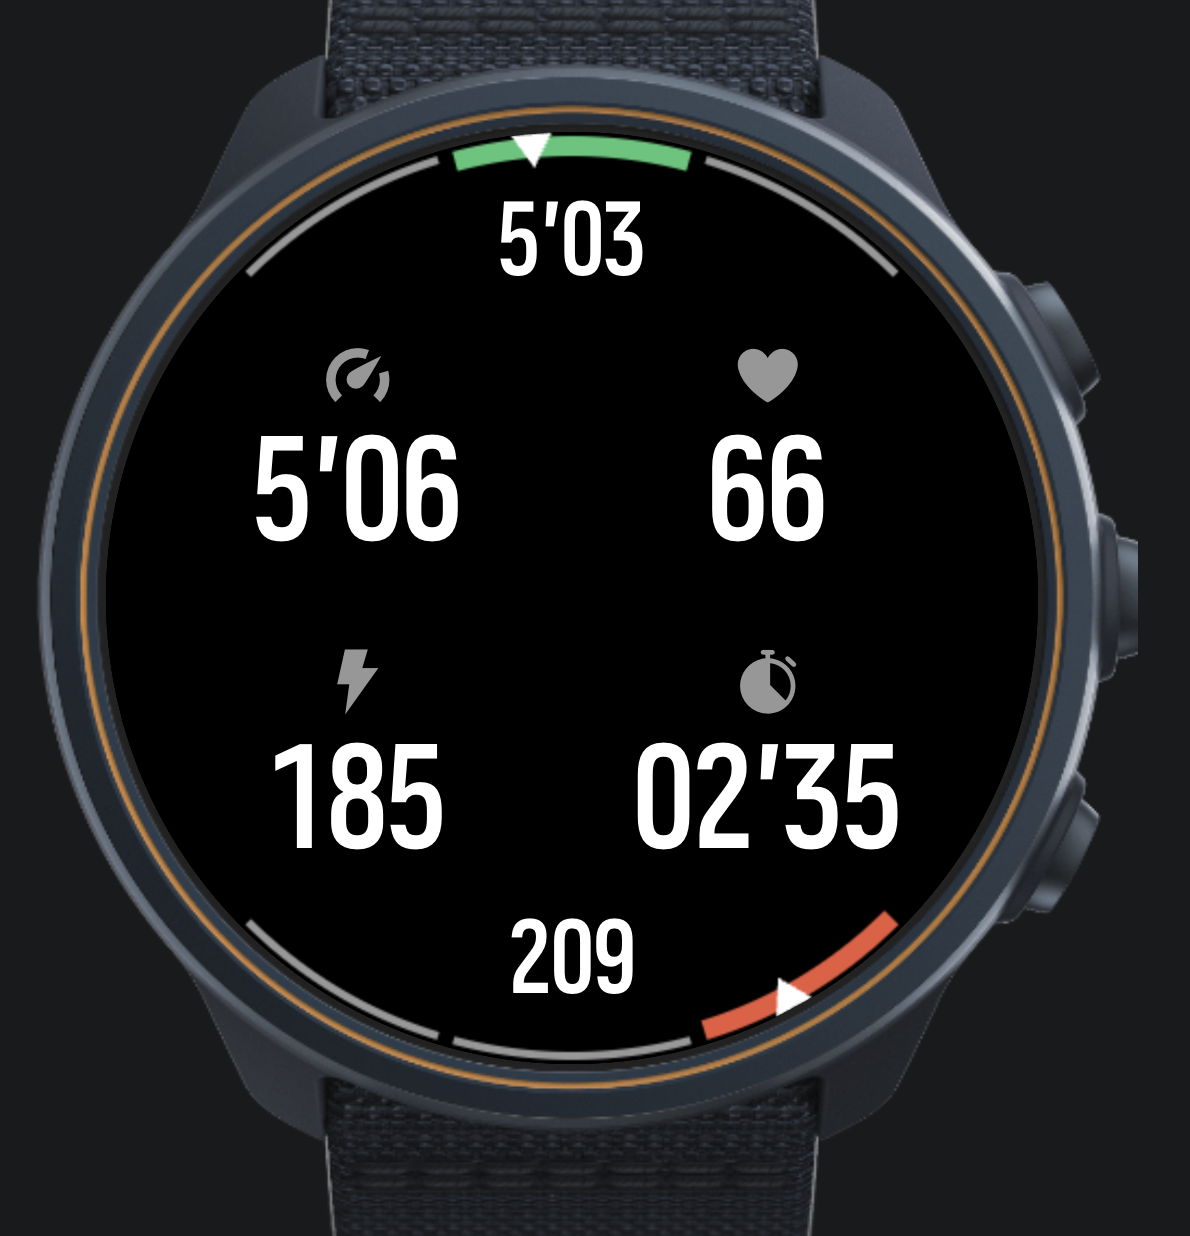
Nice experience so far, many thanks to the devs for making this possible.
My question comes to the “big picture”. I want to do structured trading with my own data screen(s). Currently I am using intervals.icu although I have been hacking on my own FIT file editor. When intervals upload training session, I get an extra data screen from intervals which I cannot modify and I also have my normal data screens which are not aware of the structure of the training.
Any hints on the best way forward to combine my data screen with structured training?
-
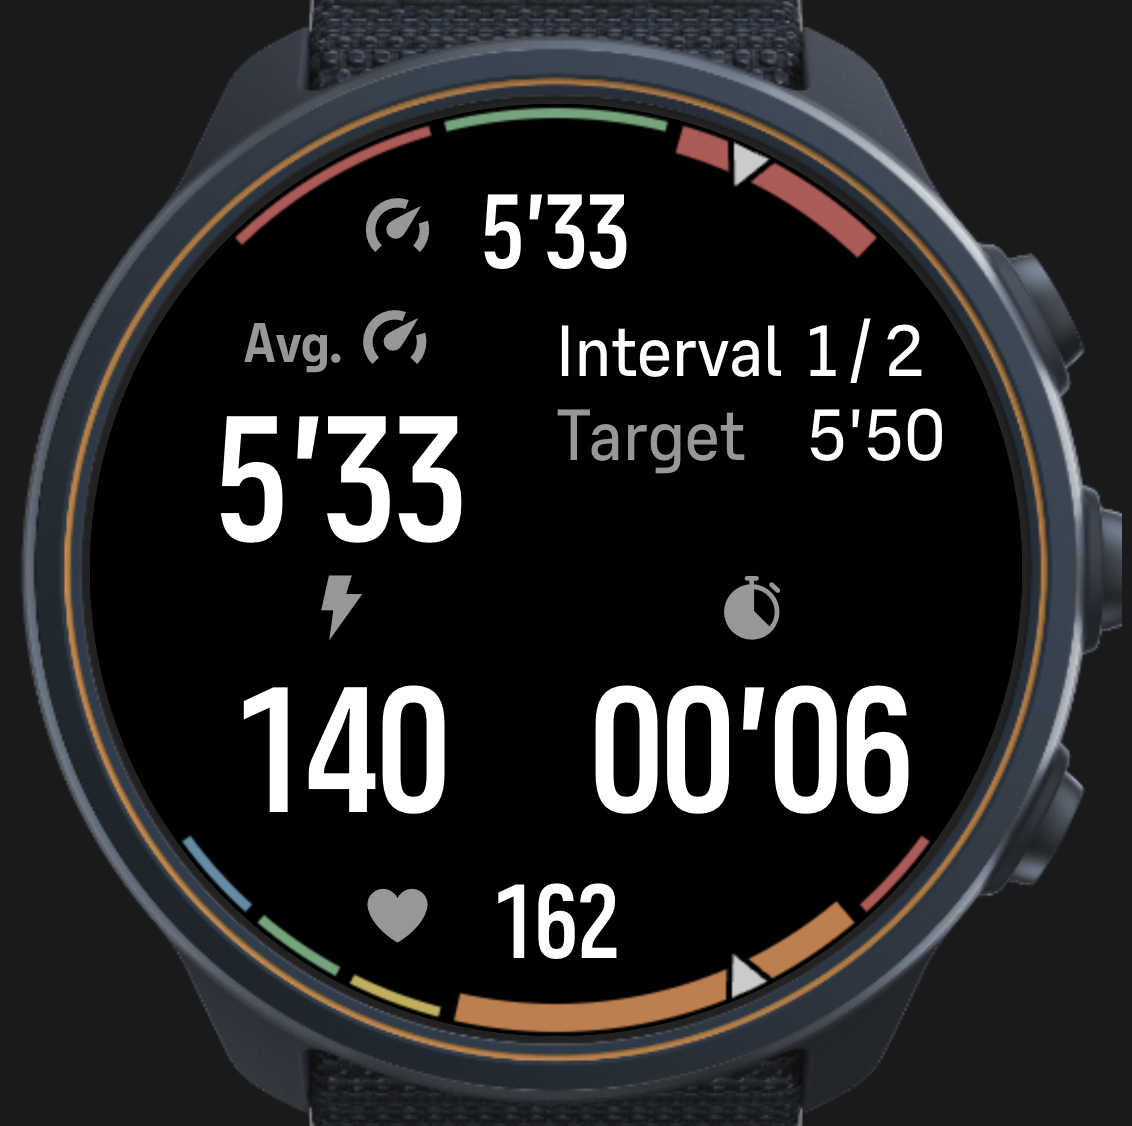
@matram How did you do this dual gauge-display? looks nice and I would be interested in learning more?
-
@DonTomGot
I did this with a canvas.These are the building blocks for the gauges.
// Draw an arc for a gauge
  // from   from angle in degrees
  // to     to angle in degrees
  // color  arc color
  // width  width of the arc
  function arcSegment(ctx, from, to, color, width) {
    ctx.beginPath();
    ctx.arc(
      radius, radius,          // center of display
      radius - 2 - width / 2,  // radius - leave a small margin outside arc
      Math.PI * from / 180,    // Angles from - to in degrees converted to radians
      Math.PI * to / 180
    );
    ctx.strokeStyle = color;
    ctx.lineWidth = width;
    ctx.stroke();
  }

  // Draw the gauge background segments
  // segmentAngles      an array of angles dividing the range, 4 for 3-zone target, 6 for 5-zone model
  // segmentColors      the color for each segment
  // activeSegment      the index to the active segment, drawn thicker
  function drawGaugeBackground(ctx, segmentAngles, segmentColors, activeSegment) {
    // Margin needs separate treatment for top (negative angles) and bottom (positive)
    var halfMargin = (segmentAngles[0] > 0) ? -1 : 1;

    // Loop over all segments
    for (var i = 0; i < segmentColors.length; ++i) {
      var ang1 = segmentAngles[i] + halfMargin;
      var ang2 = segmentAngles[i + 1] - halfMargin;

      // Determine if segment is active or not
      var width = (i === activeSegment) ? 14 : 5;
      arcSegment(ctx, ang1, ang2, segmentColors[i], width);
    }
  }

  // Draw a pointer for any gauge
  // ctx    context
  // angle  angle to draw arrow at, -90 top center, +90 bottom center
  function pointer(ctx, angle) {
    var ptrHeight = 25;     // Height of gauge pointer in pixels
    var ptrAngle = 3;     // Half angle of gauge pointer in degrees

    ctx.beginPath();
    var x1 = (radius - ptrHeight) * Math.cos(Math.PI * angle / 180) + radius;
    var y1 = (radius - ptrHeight) * Math.sin(Math.PI * angle / 180) + radius;
    ctx.moveTo(x1, y1);

    var x2 = radius * Math.cos(Math.PI * (angle - ptrAngle) / 180) + radius;
    var y2 = radius * Math.sin(Math.PI * (angle - ptrAngle) / 180) + radius;
    ctx.lineTo(x2, y2);

    var x3 = radius * Math.cos(Math.PI * (angle + ptrAngle) / 180) + radius;
    var y3 = radius * Math.sin(Math.PI * (angle + ptrAngle) / 180) + radius;
    ctx.lineTo(x3, y3);
    ctx.fillStyle = ptrColor;
    ctx.closePath();

    // Stroke with black, to create a margin around the arrow
    ctx.strokeStyle = bkgColor;
    ctx.lineWidth = 3;
    ctx.fill();
    ctx.stroke();
  }
And here the two gauges are rendered …
// The function redraws both top gauge for pace target bottom gauge for HR zones
  var renderGauges = function(ctx) {

    // Top pace gauge - first background
    var targetLow = 0.97 * paceTarget;
    var targetHigh = 1.03 * paceTarget;
    var segmentAngles = [-135, -105, -75, -45];
    var segmentColors = [outColor, inColor, outColor];
    var activeIndex = getActiveTarget(currentPace, targetLow, targetHigh);
    drawGaugeBackground(ctx, segmentAngles, segmentColors, activeIndex);

    // Then draw the pointer
    var paceAngle = -135;
    if (typeof currentPace != 'undefined') {
      var fPace = (currentPace - 0.5 * ( targetHigh + targetLow)) / (targetHigh - targetLow);
      fPace = Math.min(Math.max(fPace, -1.5), 1.5);
      paceAngle = -90 + fPace * 30;
    }
    pointer(ctx, paceAngle);

    // Bottom HR Zone gauge - background
    var activeZone = getActiveZone(currentHR, hrZones);
    var zoneAngles = getZoneAnglesHR(activeZone);
    drawGaugeBackground(ctx, zoneAngles, zoneColors, activeZone);

    // Compute angle for HR pointer
    var hrAngle = 135;
    if (typeof currentHR != 'undefined') {
      var fZone = (currentHR - hrZones[activeZone]) / (hrZones[activeZone + 1] - hrZones[activeZone]);
      fZone = Math.min(Math.max(fZone, 0), 1);
      var aLow = zoneAngles[activeZone];
      var aHigh = zoneAngles[activeZone + 1];
      hrAngle = aLow + fZone * (aHigh - aLow);
    }
    pointer(ctx, hrAngle);
  }
You will need to refresh the canvas and subscribe in .onActivate.
<uiView
onActivate = "
  $.subscribe('/Dev/Time/Tick10hz', function(){ control('#cnv', 'REFRESH'); })

  // Subscribe to HR, pace and targets to use in drawing gauges in the canvas
  $.subscribe('/Activity/Move/-1/HeartRate/Current', function(v) { currentHR = parseFloat(v) * 60; })
  $.subscribe('/Activity/Move/-1/Speed/Current', function(v) { currentPace = parseFloat(v); })
  $.subscribe('/Zapp/{zapp_index}/Output/PaceTarget', function(v) { paceTarget = parseFloat(v); })
  "
And of course add the canvas to HTML.
<!-- Canvas holds top pace gauge and bottom HR gauge -->
    <object id="cnv" type="canvas"
          build="ctx => renderGauges(ctx)"
          style="position:absolute; left: 0px; width: 466px; top: 0px; height: 466px;" />
This is my current iteration…
-
@matram Fantastic! many thanks!
-
Hi,
I’m seeing a reproducible issue with a SuuntoPlus app during active navigation, and I’d like to ask what the recommended mitigation is.
The app is called Constantin. It uses multiple UI templates for different workout views:
td.html- drift / combined viewtp.html- pace-focused viewth.html- heart-rate-focused view
The switching logic follows the documented pattern from the SuuntoPlus examples:
- the HTML template only sends a
/Zapp/{zapp_index}/Event main.jshandles the event inonEvent()main.jsupdatescurrentTemplatemain.jscallsunload('_cm')getUserInterface()returns the selected template
Simplified version:
var currentTemplate = 'td';

var changeTemplate = function(template) {
  if (currentTemplate === template) return;
  currentTemplate = template;
  unload('_cm');
};

function onEvent(input, output, eventId) {
  if (eventId === 1) {
    if (currentTemplate === 'td') changeTemplate('tp');
    else if (currentTemplate === 'tp') changeTemplate('th');
    else changeTemplate('td');
    return;
  }

  if (eventId === 2) {
    if (currentTemplate === 'td') changeTemplate('th');
    else if (currentTemplate === 'th') changeTemplate('tp');
    else changeTemplate('td');
  }
}

function getUserInterface() {
  return { template: currentTemplate || 'td' };
}
In the templates I use a mechanical button like this:
<pushButton
  name="up"
  type="lock"
  longType="lock"
  onClick="$.put('/Zapp/{zapp_index}/Event', 1, null, 'int32');"
  onLongPressStart="$.put('/Zapp/{zapp_index}/Event', 2, null, 'int32');"
/>
The UI itself is intentionally split into separate templates instead of one large
uiViewSet, because earlier versions had UI/Duktape memory pressure on the physical watch, especially when running together with ZoneSense and navigation. Splitting into separate templates reduced active subscriptions, active evals, and canvas/UI load.The problem:
When active route navigation is running, pressing the upper button to cycle templates causes a system navigation/POI notification to appear at the bottom of the screen. Sometimes it only flashes, but sometimes it stays visible indefinitely on top of the SuuntoPlus app.
The app itself continues to work. The template changes correctly. Data updates continue. But the system POI/navigation overlay remains visible.
The overlay disappears if I leave Constantin and switch to another screen/app, then return to Constantin. The problem appears only when cycling templates with the upper button while navigation is active.
Things already tested:
- removed delayed/postponed rendering from the UI
- removed
postpone-rendering:true - reduced canvas refreshes and subscriptions
- added
type="lock"/longType="lock"to theupbutton - removed a full-screen black root background
- changed the root element id from a generic
suuntoplusto unique ids per template - verified that the canvas is not full-screen and should not be covering the whole display
None of these mitigated the navigation/POI overlay issue.
So my current suspicion is that this is not caused by canvas rendering or a full-screen DOM element. It looks more like an interaction between:
- the physical upper button
- active navigation / POI system UI
- immediate
unload('_cm')fromonEvent() - template reloading during the same button event
Questions:
- Is using the upper button for SuuntoPlus template switching expected to conflict with active navigation or POI notifications?
- Is
type="lock"supposed to prevent this kind of system overlay interaction, or does it only affect button lock behavior? - Is calling
unload('_cm')directly insideonEvent()considered safe during active navigation? - Would it be better to defer the actual
unload('_cm')to the nextevaluate()cycle after receiving the button event? - Is
uiViewSet/navigate()preferred over template switching for this case, even if it increases active UI memory pressure? - Is there a recommended button for cycling SuuntoPlus views during navigation, for example
downornextinstead ofup?
What I’m trying to achieve is a stable way to cycle between 3 lightweight SuuntoPlus workout views on the physical watch, while active navigation and another S+ app such as ZoneSense are running, without triggering or leaving behind the system navigation/POI overlay.
Any guidance on the recommended architecture or mitigation would be appreciated.
-
@Tomas5
Trying to do the same thing here, with the same result. Works OK in simulator, not on RACE S.#3384733 28.05.2026 18:55:06 : ERR WBMAIN : *0: app 717 Event 37 80915318 #3384734 28.05.2026 18:55:06 : ERR WBMAIN : 1: mea 79 Wait 0 00000000Some clues. Initially this manifested as a problem with low heap memory after only a few second of HR data.
#3368541 28.05.2026 13:12:03 : ERR APPLICATION : Zapp:relMemCb (exec:ui)
#3368542 28.05.2026 13:12:03 : ERR APPLICATION : Zapp:RelMem->None avail
#3368543 28.05.2026 13:12:03 : ERR DUKTAPE : JSalloc:16
That was fixed by using a Uint8Array(400) and pruning data. That removed the “relMemCb” fault but instead I got the “ERR WBMAIN”…
It appears some resource is exhausted, and the watch becomes very sluggish after a few minutes. UI is almost frozen.
Inserting some systemEvent() calls did not reveal any specific line in the code as the culprit.
I tried performance.memory.usedJSHeapSize, but that is not supported it seems.
It would be good to have more information about available memory (or other limited resources) and some guidance on how to interpret the error messages.
Have a new Race2 on its way to me, will check if that makes any difference.
-
Play stupid games, win stupid prizes xd
TIL: the Duktape JS heap is 133,120 bytes (~130 KB), shared across all loaded zapps. At last in S9PP that is.
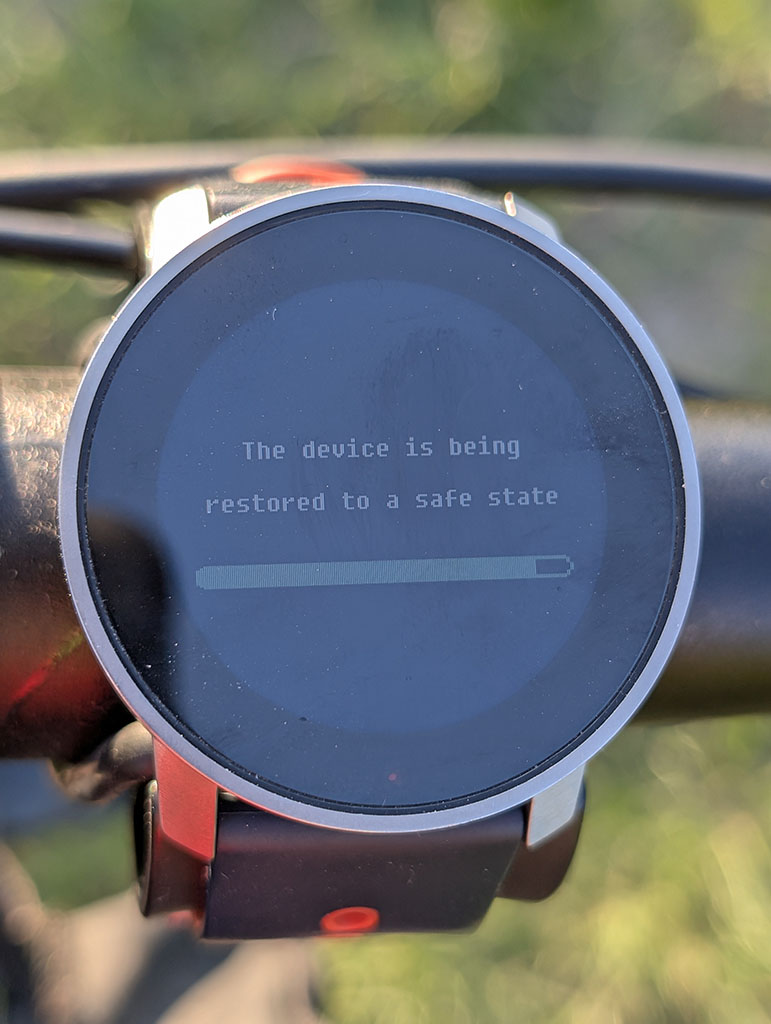
Learned this the hard way today — Constantin crashed my watch three times, once into a full firmware restore.
I merged my three view templates into one to fix a button-lock bug during route navigation. Bad idea. Each template is ~30–45 KB; all three loaded simultaneously at
onLoad= ~130 KB = 99.4% of the entire heap before ZoneSense even shows up. The system tries to recover by force-unloading the offending zapp, which then reloads, fills the heap again, repeat, until Duktape can’t allocate 1392 bytes and crashes:WRN UI_FRAMEWORK : JsTotMem 132296/133120 ERR APPLICATION : Zapp: releaseMemoryCb → Zapp 3: ReleaseMem -> unload [×3] ERR APPLICATION : Zapp: ReleaseMem -> None avail. ERR DUKTAPE : JSalloc:1392 [×11] ERR FAULT : A302:duktapeFunctionCombiner.cpp EVT BOOTLOOP : Bootloop detected, sysmode 5->17Good to know: ≤ 30–40 KB per feature zapp, one template at a time. With ZoneSense (~30 KB) and Weather (~15 KB) running alongside, headroom is very tight.
The watch is fine. I’ve reverted to the multi-template build. The original nav overlay bug is still open — if anyone’s solved the
unload/type="lock"gap problem without blowing the heap, I’d love to hear it. -
How can I read current wind gusts in a SuuntoPlus app?
I’m working on a SuuntoPlus app that displays current weather and forecast weather data. I’m trying to show wind gusts for the current weather, but on the actual watch I only get
--.In my template I currently read current weather like this:
$.get('/Weather/Current', function(v) {
  gWxNow = v;
  renderNow();
});
and then I try to render current gusts with:
setText('#nowWg', windStr(v.windGust));This works only if
/Weather/Currentreturns awindGustfield. On the watch, however, this seems to beundefined, so my formatter returns--.What confused me is that in the SuuntoPlus VS Code simulator internals, the weather mock seems to return a richer weather object. In
suunto-internals,getWeatherData()includes fields such as:{ humidity: 43, feelsLike: 293.15, temp: 293.15, weatherType: 2, windDeg: 230, windType: 5, windGust: 8, windSpeed: 6, pop: .23, rain: 1.2 }So in the simulator,
v.windGustcan exist on the weather object.But from the documented data paths,
/Weather/Currentseems to expose only something like:{ temp, weatherType, windSpeed, windType }and the listed current paths appear to be:
/Weather/Current
/Weather/Current.temp
/Weather/Current.weatherType
/Weather/Current.windSpeed
/Weather/Current.windType
I can read forecast gusts separately with a path like:
/Weather/Future/N.windGustor at least this seems to work on the watch for forecast data. But I have not found an equivalent reliable path for current wind gusts, such as:
/Weather/Current.windGustMy main question is: is there any supported way to read current wind gusts in a SuuntoPlus app on the actual watch?
I also have a related question about forecast index
0.What is the intended meaning of:
/Weather/Future/0How is
/Weather/Future/0different from/Weather/Current?Is
Future/0the nearest hourly forecast slot, the current forecast hour, or something else? I’m asking because if current gusts are not available, one possible fallback would be to use/Weather/Future/0.windGust, but I’m not sure whether that would be semantically correct.More specifically:
- Does
/Weather/Current.windGustexist on hardware? - Should current gusts be read from another path, for example Observation data?
- Is
windGustonly available for forecast data, not current weather? - Is the richer weather object in the VS Code simulator only mock data and not representative of the real watch API?
- What exactly is the difference between
/Weather/Currentand/Weather/Future/0?
Right now, on the watch, current weather gusts display as
--, while forecast gusts can be displayed.Tested on hardware, not only in the simulator. The issue is that the simulator mock appears to include
windGustin the current weather object, but the actual watch does not seem to expose that field.Thanks for any clarification.
- Does
-
I have a couple of questions.
- Is there a way to copy the built-in workout to a new workout while keeping the modified personal workout settings?
I do understand that the app does not allow modifying any of the in-built workouts, but it’s great to be able to copy them as new personal workout settings and modify them as you want, rather than creating them from scratch.
-
In-built options for workouts on the watch must be able to modify and save for next use, especially for the battery. As of now, battery mode reverts to Performance, even though I don’t need it in my regular usage. This is an extra checkpoint you have to complete before you start your workout every time.
-
Even if I change battery mode, it won’t let me change what display setting I want.
-
The map gets disabled on the watch. The map is already downloaded on the watch; you are just showing me where I am. This does not make any sense to disable map display.
By the way, I use Race S as of now. My old Ambit 3 still lets me modify every setting as needed. I don’t understand why I am forced to use a performance mood every single time, even though I don’t need to.
-
The map gets disabled on the watch. The map is already downloaded on the watch; you are just showing me where I am. This does not make any sense to disable map display.
The map is enabled only in Performance mode. According to discussions that I’ve seen in this forum, the cost of preloading loading map segments from the storage is such that if it was enabled in modes other than Performance, the battery use would still be almost the same as in Performance mode.
I don’t understand why I am forced to use a performance mood every single time, even though I don’t need to.
Honestly I don’t understand why anyone would want to use a battery mode other than Performance. We are talking about 30 hours in Performance mode vs. 40 in Endurance. For everyday training that doesn’t make much difference because the majority of the battery use comes from the smartwatch usage outside of activity, which comes close to roughly 10% per day with raise to wake display activation.
Let’s just assume that someone trains 1 hour per day with GPS. When using Performance mode, in a week 70% of use will come smartphone mode and 23% from recording activities. And if someone uses Endurance mode - 17% of use would be from recording activities. So at the end, it is a difference of 93% vs. 87% - not a significant difference at all.
When I used Race S I didn’t bother and just used the Performance mode every single time. The only case when I’d consider Endurance mode is if I was doing a 100 mile ultramarathon with Race S.
-
@sky-runner Thanks for explaining battery usage and map/GPS, but every % of power counts in remote places, where charging would be an issue, unlike at home.
If loading maps consumes the same amount of power even though they are preloaded on the device, what is the point of having them preloaded? It is important that you are not always on the map; at times, check where your location is or where you are heading.
So it might use a little more battery while checking maps, and again, back to endurance mode to gain more power backup. My question is: why forcibly disable instead of giving a prompt and letting them continue with the map? It’s a matter of safety, too; you want to know whether you’re where you are or headed in the right direction.
And an important question: where is all this information mentioned in the manual? When I asked this question to a support person on chat, there was silence, and no response came for a very long time.
Anyway, nice to get a response from you and make me understand.
-
@matram I tried including your brilliant design - but - I am very new to Javascript (all modern languages in fact). What pieces of code are supposed to go where in terms of .js files etc?
-
@DonTomGot
No problem, I am more of a Swift guy myself.The functions arcSegment, drawGaugeBackground, pointer and renderGauges are declared as in the onLoad method in t.html.
onActivate is also in t.html, same as the onLoad method.
The canvas declaration goes at the end of the HTML code in the same file.
Good luck

-
@matram Many thanks for taking the time in helping out. Even the very basics is a puzzle from my background/my low level programming skills; but I am not giving up.
I included your code in the html-file, but understand there is also some logic needed - but cannot really figure out what variables that need to be controlled from the .js side of things? I have understood that PaceTarget is critical in your implementation, but outside of that I cannot really see what I might be missing? (I cannot get it to render in the simulator, and it appears your screen is from the simulator - so I suppose it should work also in simulator?)
To provide some more info: I have included the mentioned functions in the html (onLoad / onActivate) and the canvas declaration. But no results in the simulator.









Hello! It looks like you're interested in this conversation, but you don't have an account yet.
Getting fed up of having to scroll through the same posts each visit? When you register for an account, you'll always come back to exactly where you were before, and choose to be notified of new replies (either via email, or push notification). You'll also be able to save bookmarks and upvote posts to show your appreciation to other community members.
With your input, this post could be even better 💗
Register Login