ZoneSense
-
@jussim i didnt got red zone while doing intervalls… Heart rate Zone 5 but zone sense says GREEN ??? Whats going on here?
-
@GiPFELKiND as far as I understand it, reacting on short intervalls is NOT what Zonesense is capable of and made for. It’s more suitable for longer „phases“.
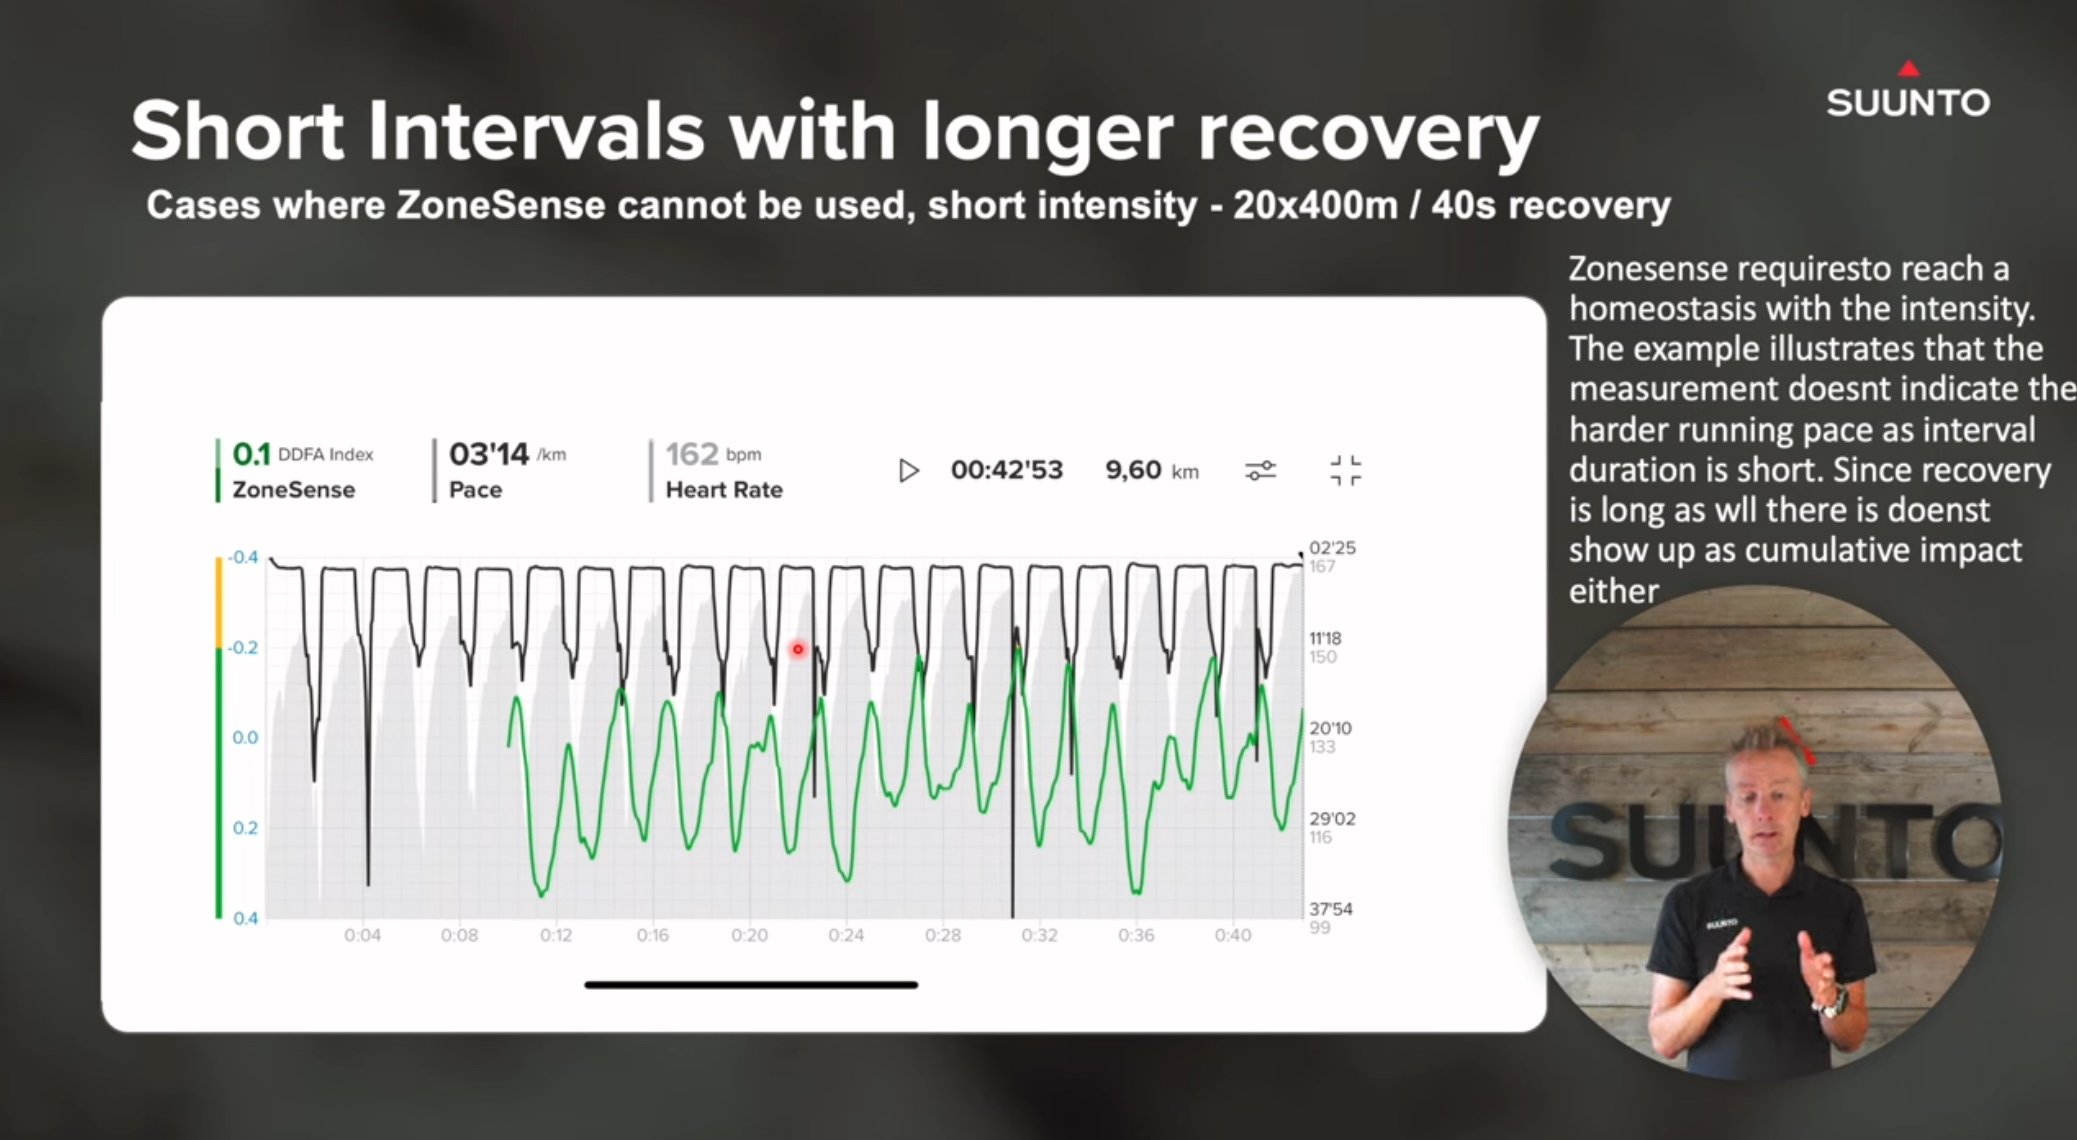
Actually I would interpret it that way, that your interval workout was deemed aerobic as a whole and that you could increase intensity, if you want. Zonesense is not about HR measurement, Suunto says, but about Heart measurement, measuring the stress of the heart. And I think it makes sense, seeing that after your short intervals Zonesene tracks you moving into higher aerobic states.
There is a pretty good youtube video from Suunto, describing this.
Currently Race I
-
-
@Mff73 I suspect what this is saying is that your heart doesn’t like it much when you run up and down mountains
") The time you were at the top and when you were on the flat bit near the end it was much happier
The time you were at the top and when you were on the flat bit near the end it was much happier -
-
Actually I would interpret it that way, that your interval workout was deemed aerobic as a whole and that you could increase intensity, if you want. Zonesense is not about HR measurement, Suunto says, but about Heart measurement, measuring the stress of the heart. And I think it makes sense, seeing that after your short intervals Zonesene tracks you moving into higher aerobic states.
This is by far the easiest to digest explanation of the behavior I have seen. This makes perfect sense.
-
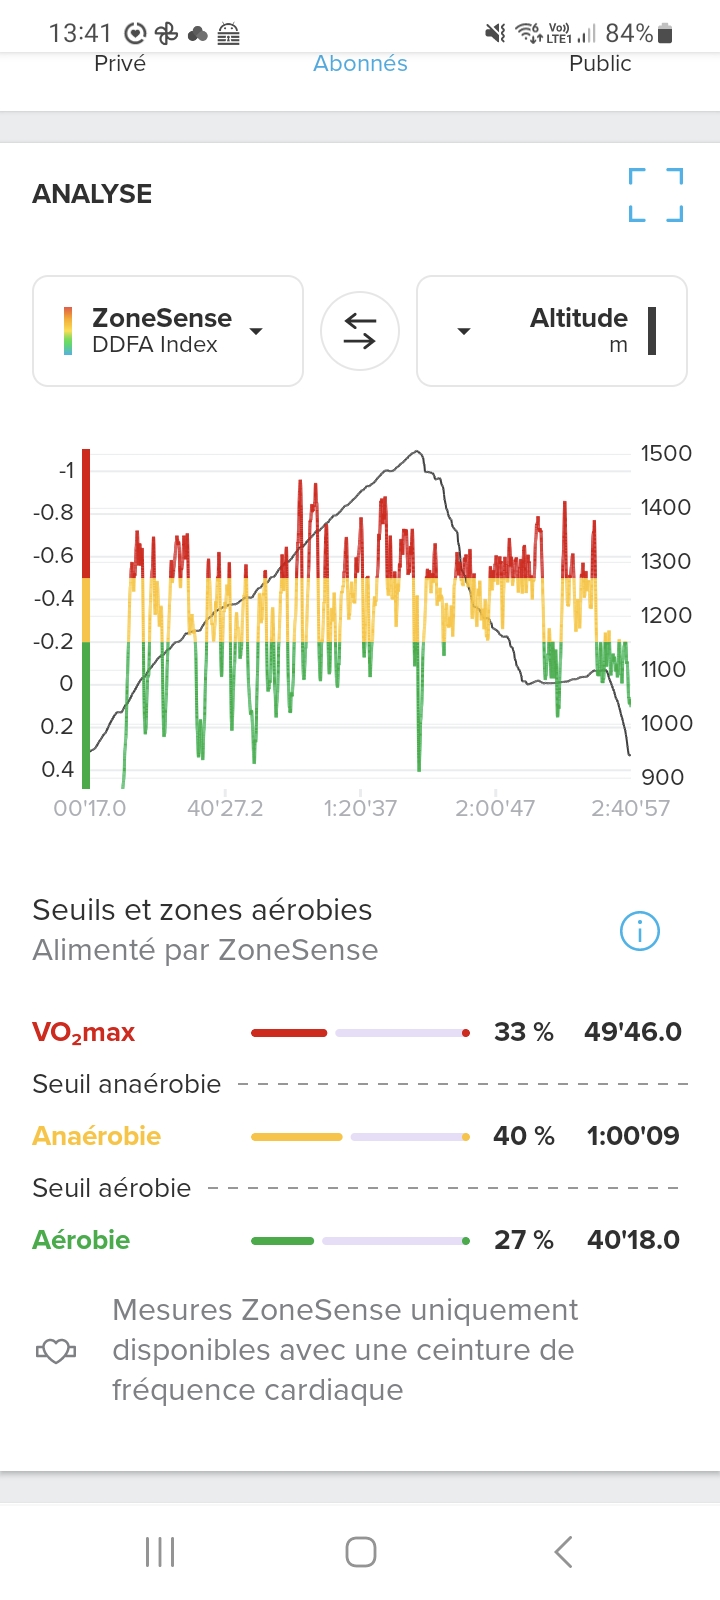
No it’s my turn to have questions about ZoneSense. Today I did a run that felt fairly easy and so my ZoneSense stayed mostly green and the graph in the App agrees with that:
If we look at the detected thresholds ZoneSense thought it is a bit lower today - I can live with that…
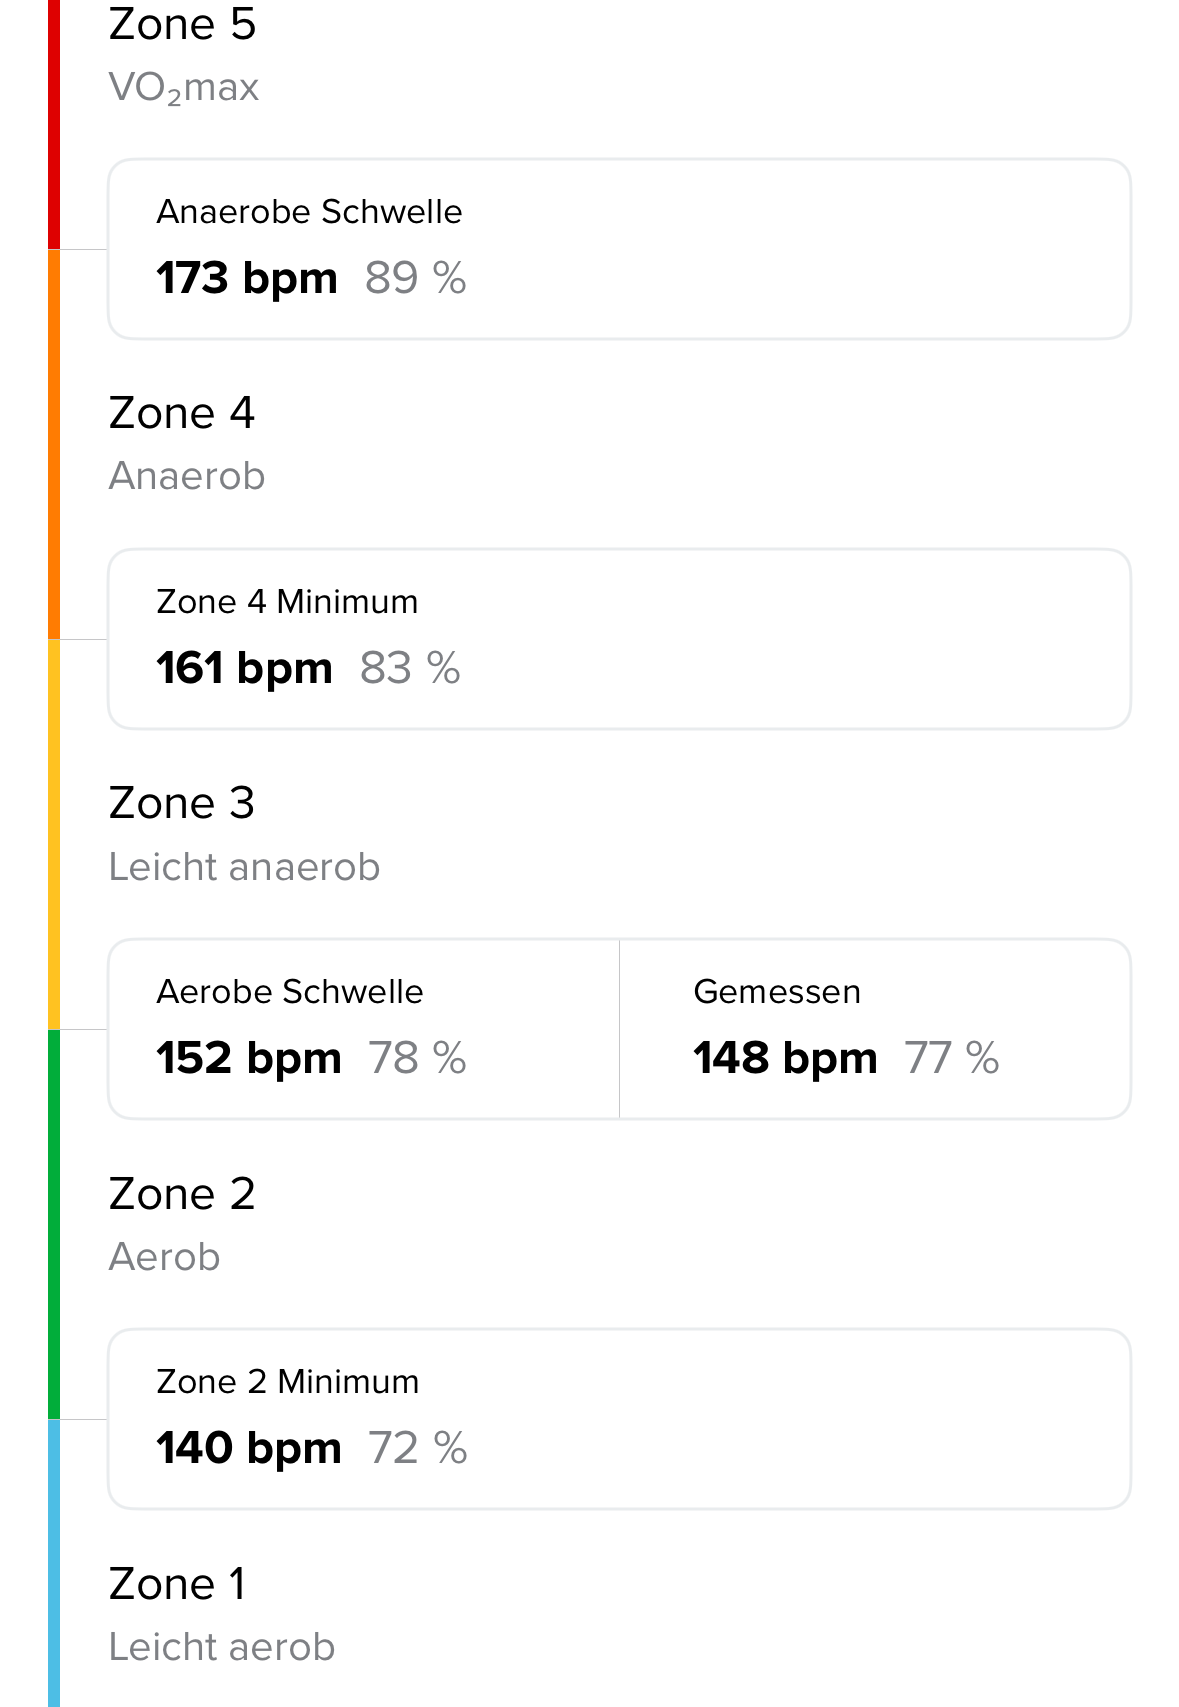
No second threshold - it was an easy run.
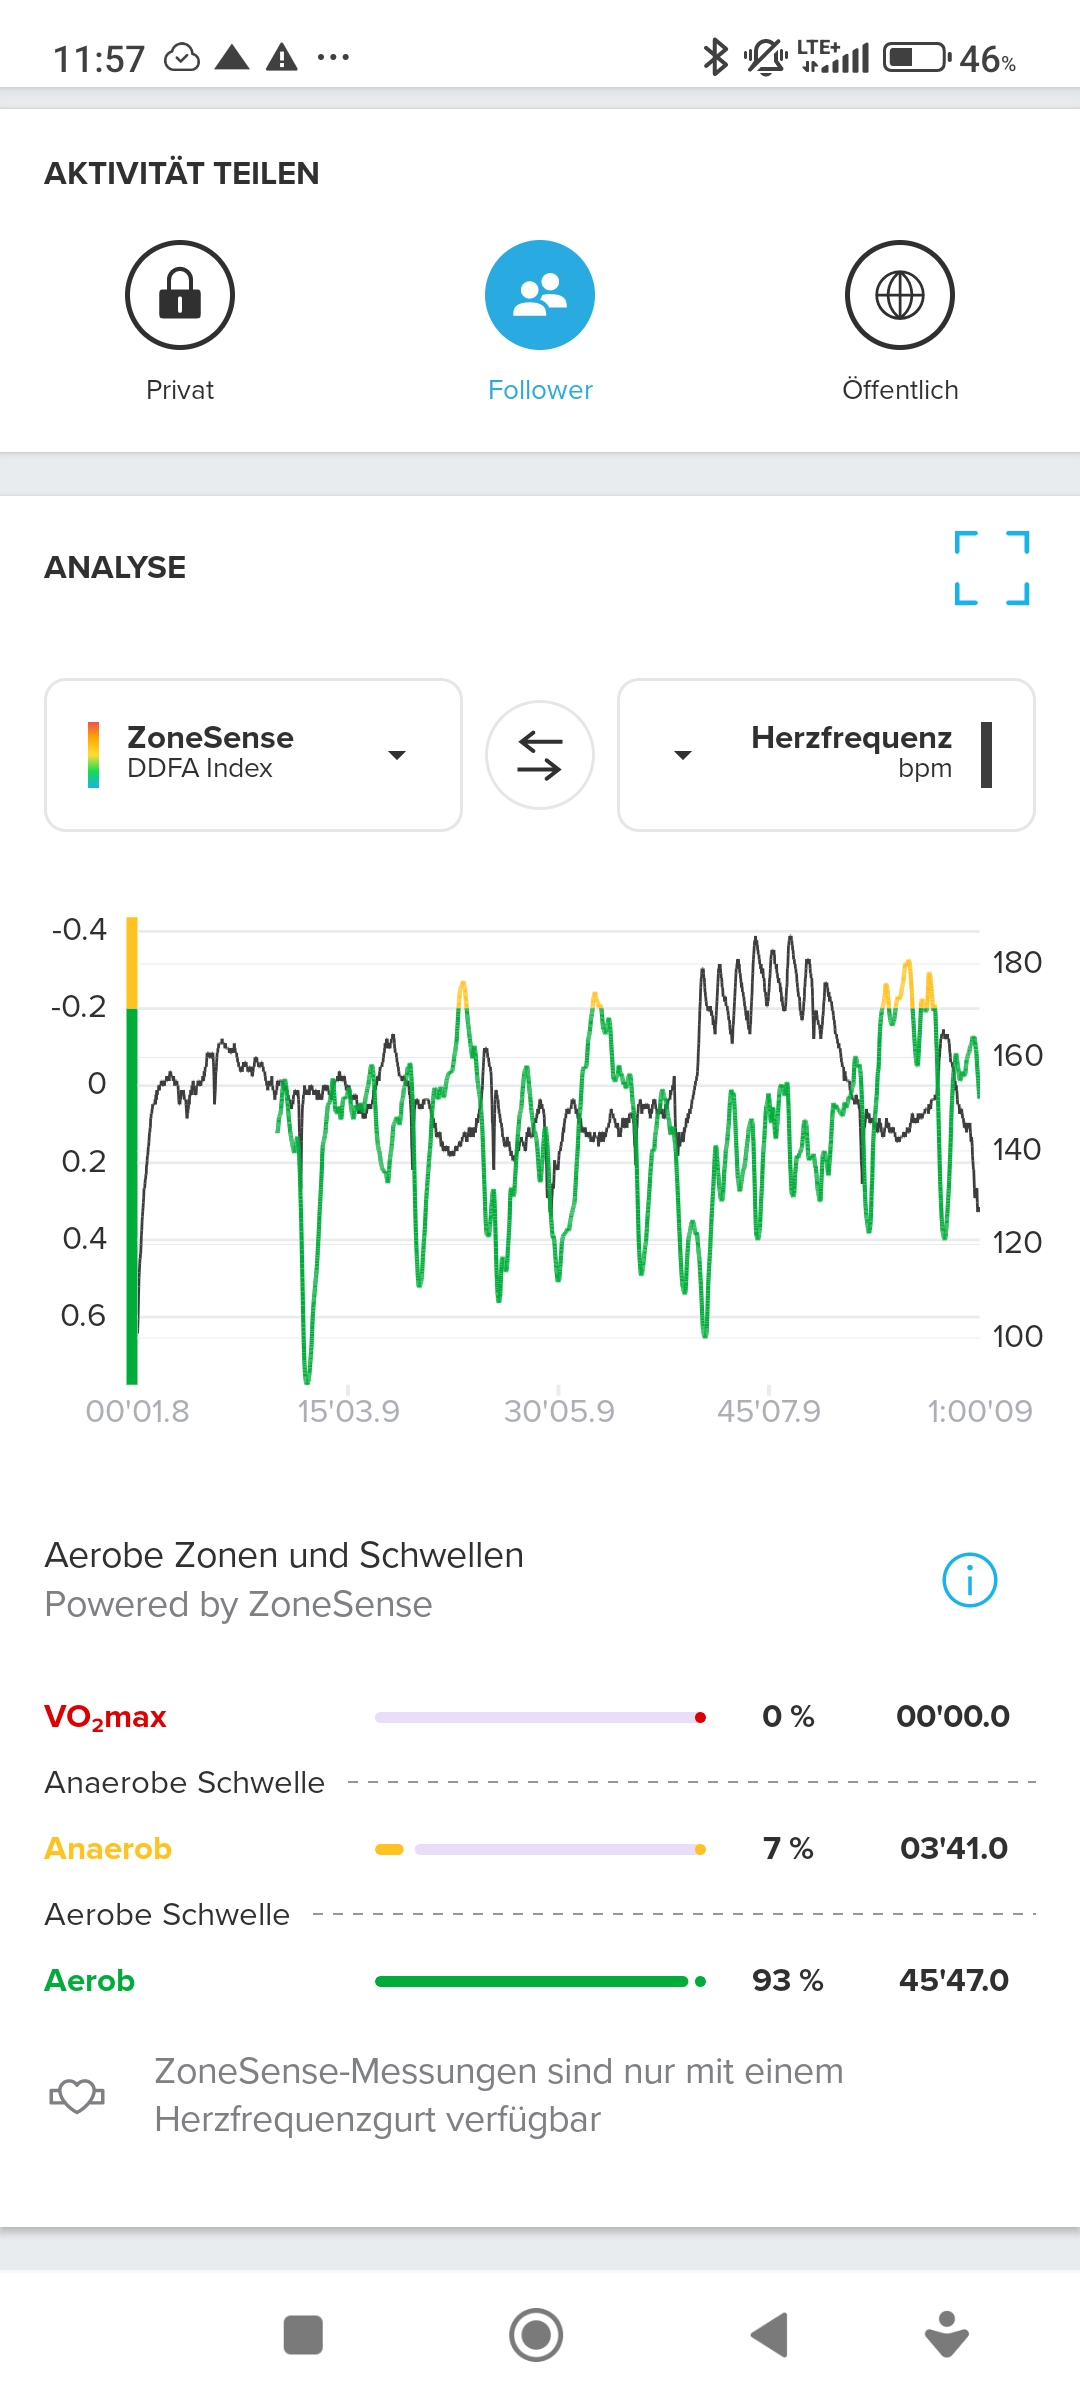
So far so good. If we take in consideration that I set my LT1 to 152 and ZoneSense even lowered that to 148, I wonder why ZoneSense agreed with easy, when I look at my real heart rate recordings:
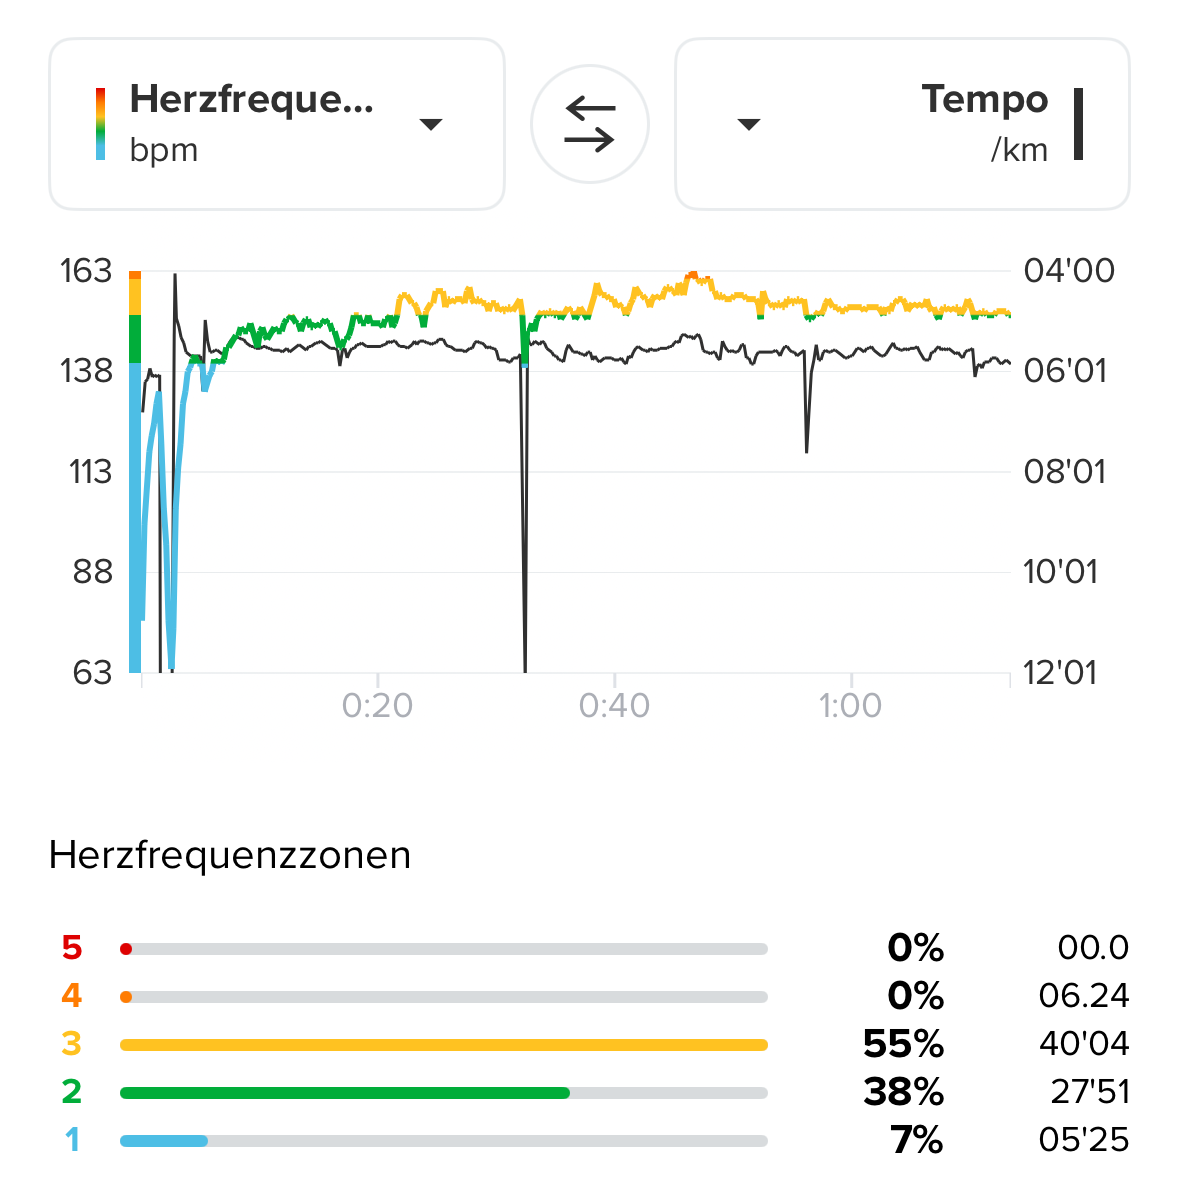
It gives me 55% of the time above 152, so above 148…
If the data makes sense somehow, possibly the presentation in the app is not reflecting that?
-
@2b2bff You said it felt fairly easy and the ZS reflected that. I find ZS matches my RPE very well.
-
@Brad_Olwin said in ZoneSense:
You said it felt fairly easy and the ZS reflected that. I find ZS matches my RPE very well.
yeah I get that, but what about that heart rate discrepancy?
Suunto Race S
Garmin Epix Pro -
@2b2bff Why is there a HR discrepancy? ZS is reporting effort in real time. HR Zones are set either from lab or field test and are good only on the hour/day you test. That is the power of ZS. HR zones will change depending on stress, sleep, caffeine, training,fatigue,etc
This is the reason to use ZS! It is not a tool to find HR zones but instead a tool to measure real time effort. I have not had enough time in VO2M to assess that transition but I know when I cross my LT as my breathing changes and ZS is showing that transition well.
-
what about that heart rate discrepancy?
Your “Measured” “Aerobic threshold” of 148 bpm for that day is just a bone thrown to our obsession with exactitude. I don’t know if it is an average for the whole exercise, or the very first instance of measurement (observe we don’t get the number on our watches), but it is supposed to detect (I’ve forgotten the used terminology) when our HRV-system goes: ‘Hmmm… This doesn’t look like rest anymore’ [i.e. LT1]. Overall, the Heart Rate can be seen as living its own life - think about Pulse Drift for example - while HRV and its associated hormones and chemicals live another. The two measurements can at times be very decoupled.
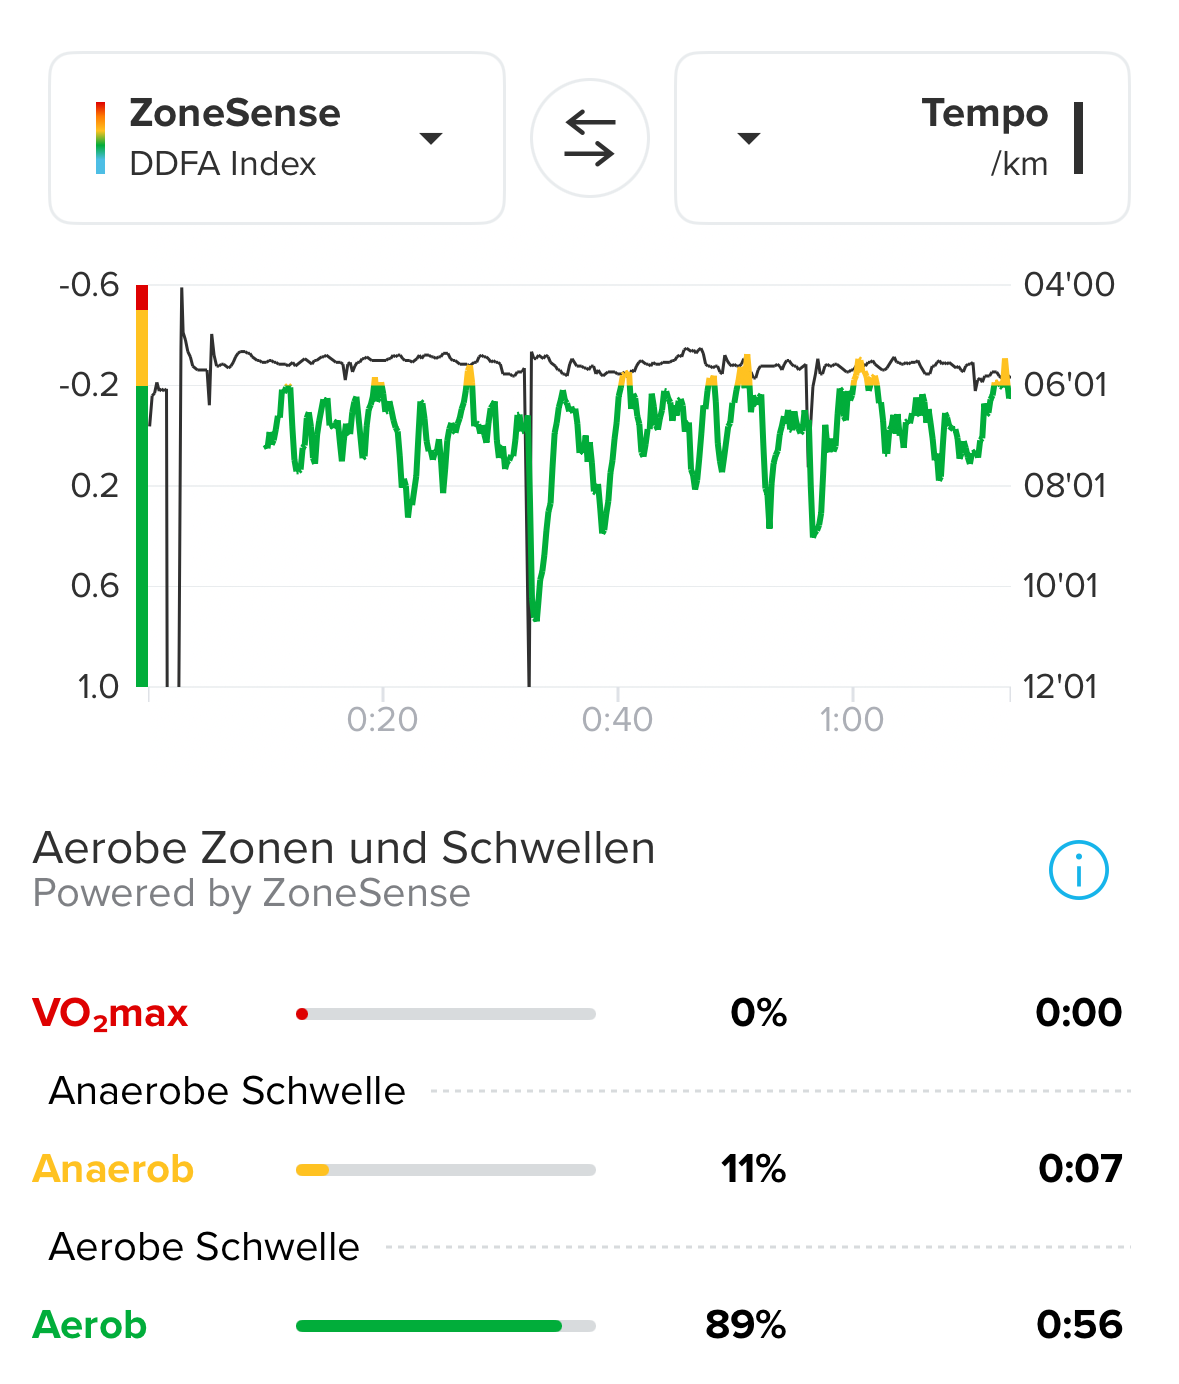
Let me offer a recent exercise of mine which illustrates the decoupling in stark detail. I’m not used to running much above easy LT1 sessions, so the slightly below LT2 Pace-based 8x3 minutes with 1 minute jogging rests was an ordeal. In fact, I had to cut it short at 7 times because I was completely knackered; at such an extent that I had to start walking as the Cool Down instead of doing a normal running end. The “Measured” “Aerobic threshold” for the day was 145 (lab-measured some years ago as 148) and the first screenshot below is just to show, with a marker, where HR is in step with that threshold at the beginning. 3 minute intervals are not enough for ZS to shine, but it shows the exhausting trend quite accurately. There’s a HR dropout of ca 1 minute at about minute 22 - hence the flat lines in both graphs:
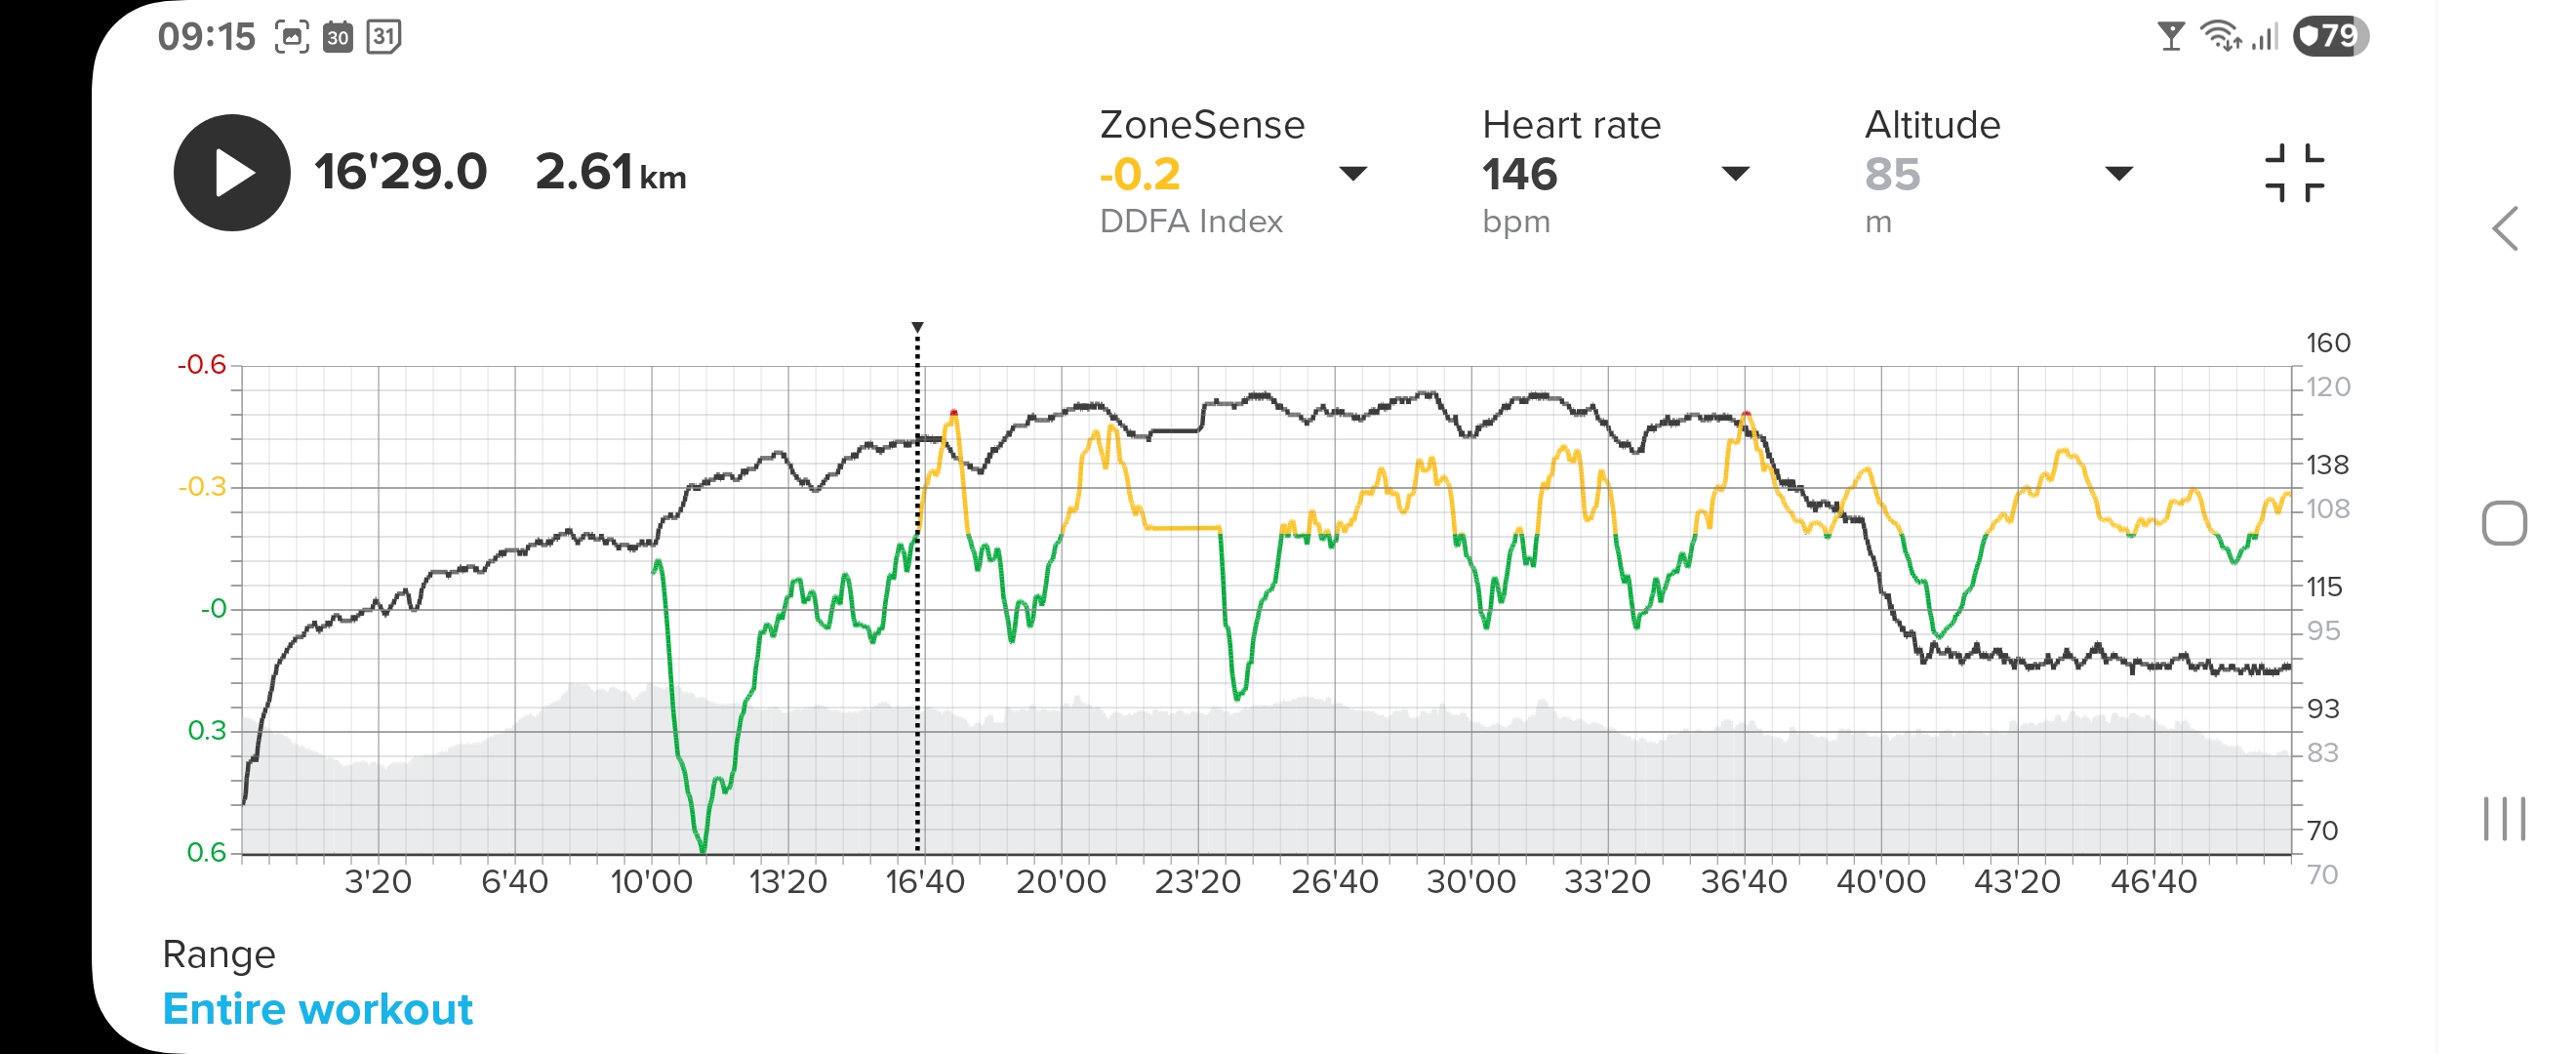
The next two screenshots have the marker at almost the same time (hard to manoeuvre with a finger) with the colourised ZS and HR versions of the graphs. At that time I’m walking in the “Light aerobic” HR Zone with 106 bpm, but as ZS shows well and truly Anaerobic. I was exhausted:
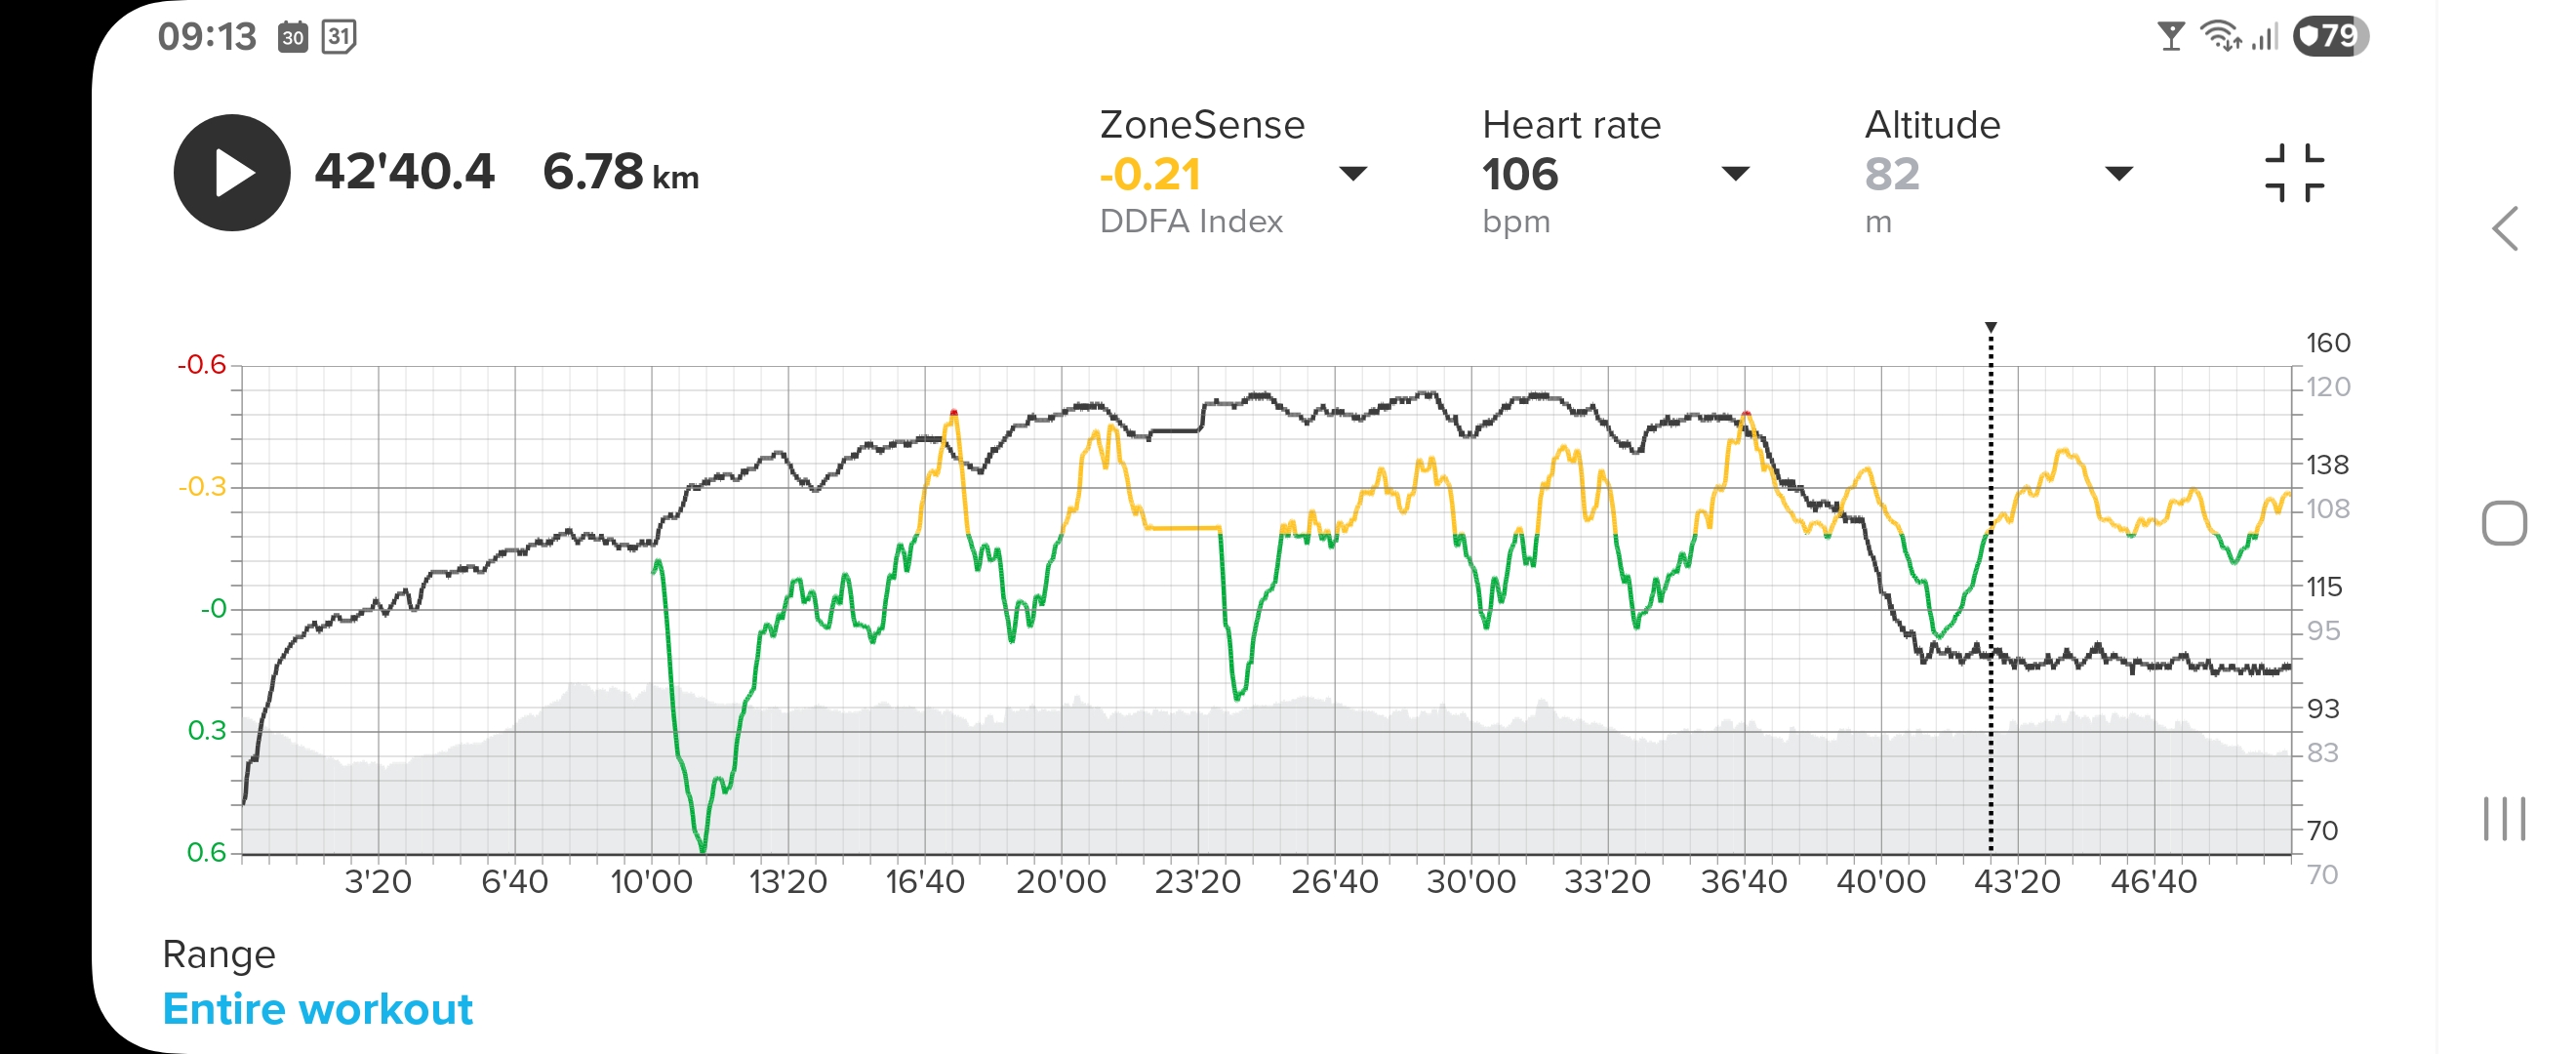
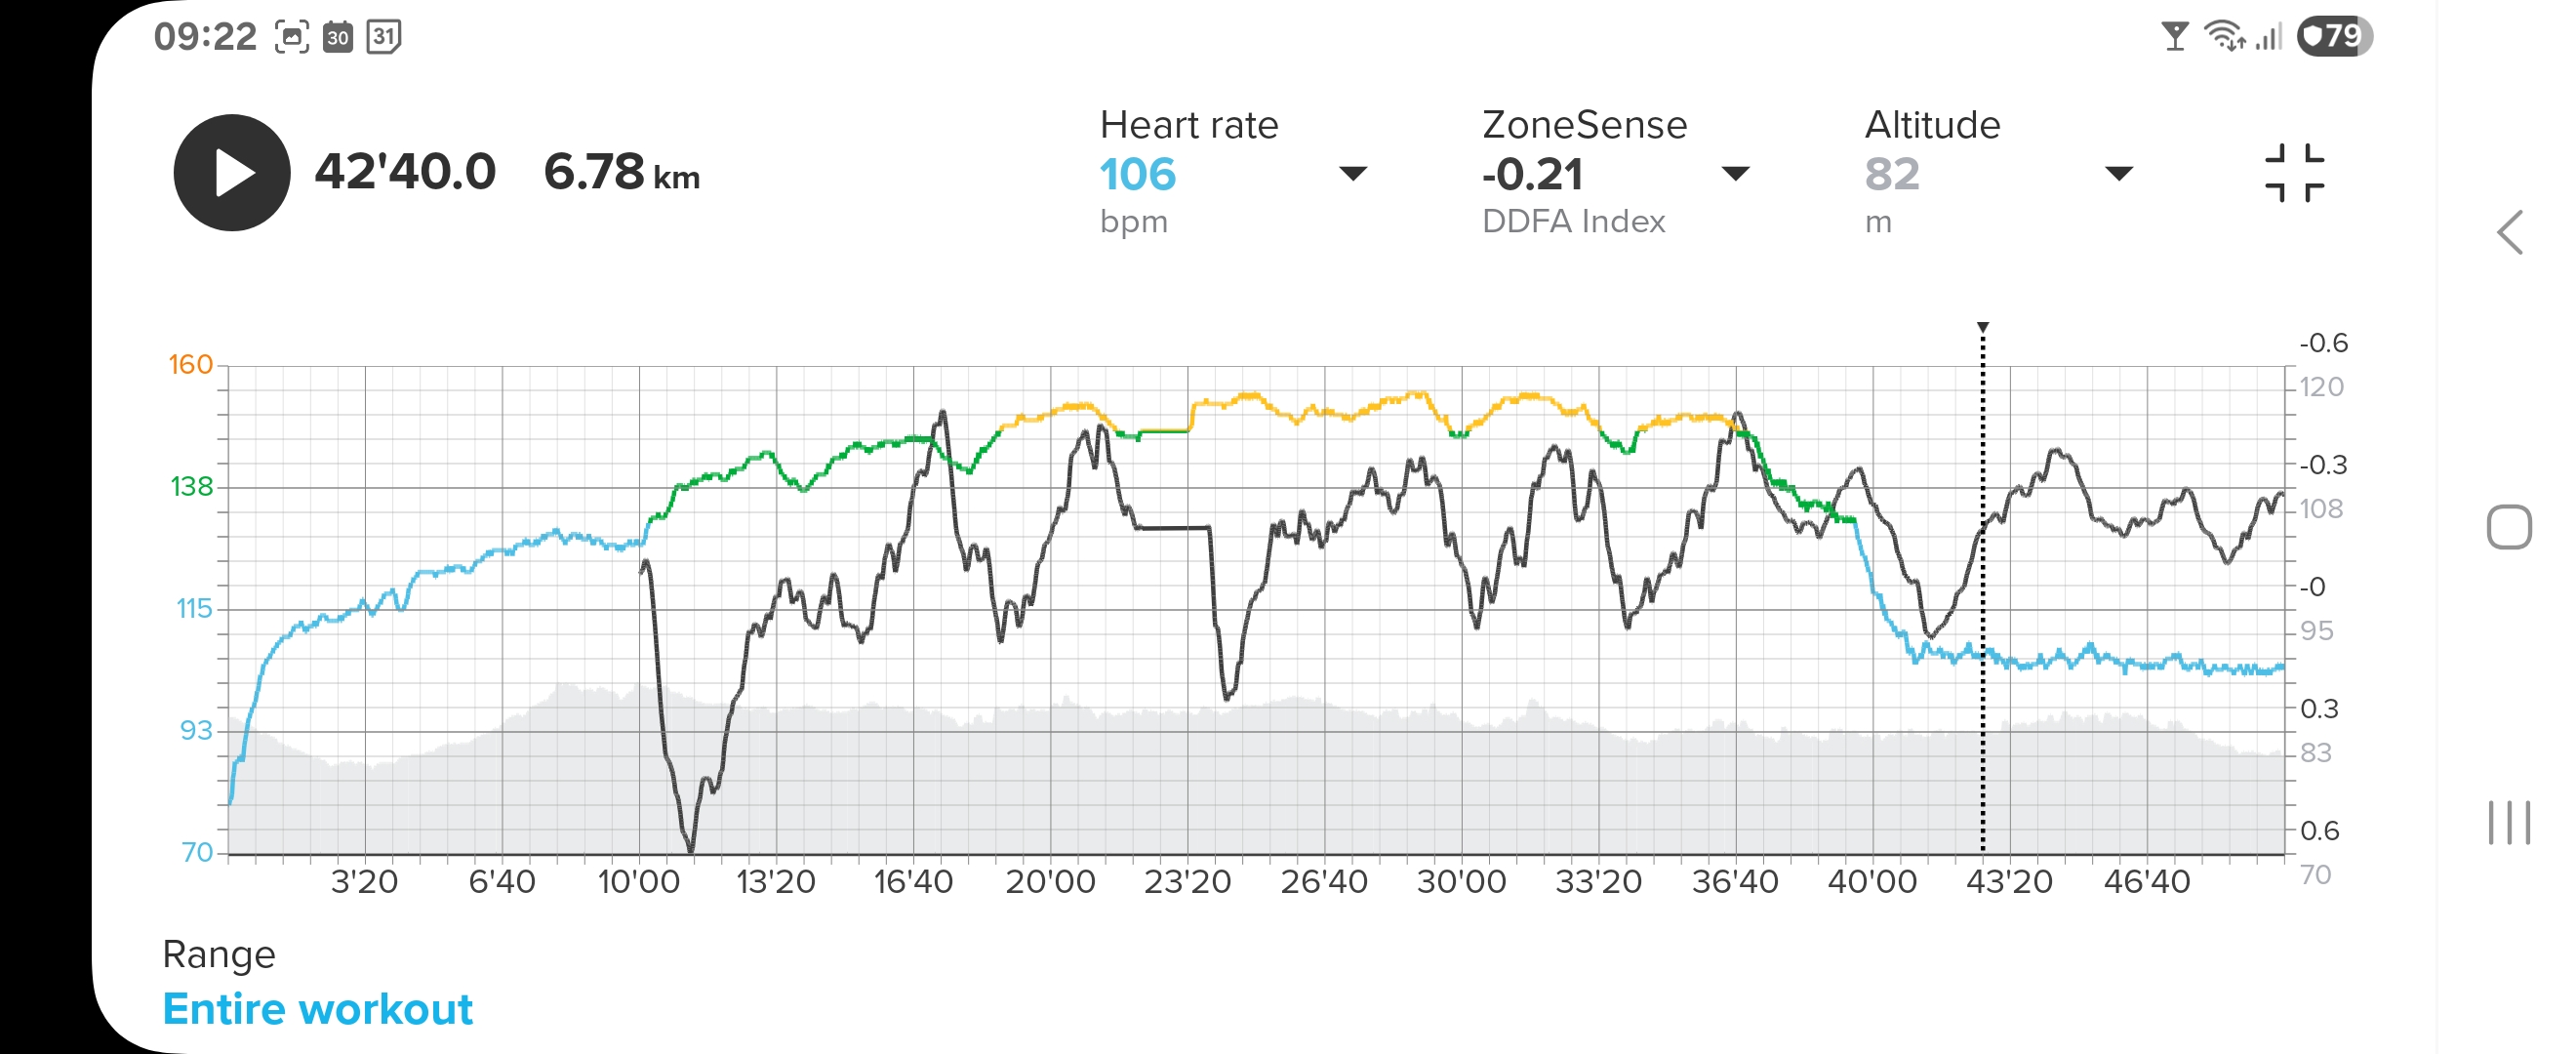
In this instance there really is no sense in talking about an “Aerobic threshold” of 145 bpm
-
@Brad_Olwin That’s what I meant with: If the data is okay, maybe the visual representation is not optimal.
After some reasoning: There is no sense in having one HR pinpoint as LT1 if LT1 shifts throughout the workout. So the presentation of the measurement as one number it not reflecting the reality.Suunto Race S
Garmin Epix Pro -
@2b2bff That is why there are 3 zones, green aerobic, yellow mixed aerobic/anaerobic and red anaerobic. No need to fixate on a single HR number. The number you get is the predicted for THAT workout.
-
@2b2bff I agree with the presentation as being suboptimal, but how to change it? On the one hand there is the oldish training philosophy with rather static HR Zones (3, 5, 7, 9 or whatever, depending on the specific seller of books and methods), on the other there is some newer attempts of a more dynamic view, like ZS, where HR in itself plays a less prominent role.
In the example you provided you obviously had a very good day, where the HR (post 20 some minutes) could average about 155 bpm without the Nervous System/Brain starting to pump too much Lactate into the blood stream. In my example exercise, which was designed to reach and keep Lactate at about 3 mmol/l in the main segment, the Nervous System/Brain put its foot of protection down at the end by forcing me to quit and walk, and at the same time refusing to clear Lactate even with a low HR.
How can these fluid situations be grafted unto a list of HR Zones and Thresholds? Perhaps they shouldn’t… Perhaps anything Zone Sense should be kept as a separate page with more elaborate explanations.
-
@Brad_Olwin if the number is predicted for THAT workout - and it keeps consitent throughout the workout, so why have I been below LT1 most of the time according to ZoneSense and at the same time I have been in Zone 3 - above LT1 - according to the HR measurement. Even though the ZoneSense LT1 is below what I configured as the starting HR of my Zone 3?
That was the whole point of my question…@Inge-Nallsson I honestly don’t know. Possibly Suunto should take out that screen that you get when touching (i) alltogether. The two graphs make sense to me. That other screen left me clueless…
-
@2b2bff I think I could make this clearer if we were speaking. You are assuming AT based on an HR measurement that is not valid. For example, my tested AT is 142 and the tests are not super accurate so let’s assume 140. Yesterday ZS gave me an AT of 128 so I could ask the same question. Why am I anaerobic when I should be aerobic based on ZS? (This is the opposite of yours).
It is because my AT was not 140 yesterday it was near 128 because of likely many factors, my training schedule, my fatigue, etc. If my AT was 148 instead of 140 according to ZS it would be because I was well rested and likely slept well and maybe in a recovery week. HR for AT is not a fixed value and will depend on many physiological factors. ZS provides a real-time estimate of AT.
-
@Brad_Olwin please forget your enthusiasm about ZoneSense for a second and don’t try to convince me that is the best invention since sliced bread. I already know that
")
Please take a look again on the data I provided. Just look at the numbers:
-
ZoneSense gave me this in the workout: LT1 at 148 bpm and 56 minutes green - aka below LT1 - and 7 minutes yellow.
-
Looking just at the HR for the very same workout: LT1 was set to 152 bpm and I have been 33 minutes below that and 40 minutes above it.
How can I be 40 minutes above 152bpm and at same time be only 7 minutes above 148bpm? That is what I’m trying to understand.
-
-
@Brad_Olwin please forget your enthusiasm about ZoneSense for a second and don’t try to convince me that is the best invention since sliced bread. I already know that
Please take a look again on the data I provided. Just look at the numbers:
-
ZoneSense gave me this in the workout: LT1 at 148 bpm and 56 minutes green - aka below LT1 - and 7 minutes yellow.
-
Looking just at the HR for the very same workout: LT1 was set to 152 bpm and I have been 33 minutes below that and 40 minutes above it.
How can I be 40 minutes above 152bpm and at same time be only 7 minutes above 148bpm? That is what I’m trying to understand.
As I keep attempting to say the 148 is an estimate made by ZS and only an estimate. You are too fixated on what a zone is. For example, you could be at 150 and in ZS green if the R-R data suggests you are below anaerobic. These are NOT fixed zones and 148 to 152 is a small difference. ZS is estimating aerobic and anaerobic efforts based on R-R data and is well correlated to a tested population in published studies.
I stated before that the HR numbers are an estimate whether done by a lab or by ZS. So, you were 40 min above 152. How much of that was anaerobic and how much was aerobic? Your body does not function as a switch. There is no hard zone where at 148 you are 100% aerobic and at 149 100% anaerobic. My point I keep trying to make. The numbers do not accurately depict your physiology. I am a prof and my lab does research on skeletal muscle repair and aging focusing on stem cells. Your muscle is highly adaptable and while HR generally will match your effort, your LT1 likely varies by at least 30 bpm depending on training, stress, fatigue, etc. Also, the physiological tests to measure LT1 are not precise.
I will agree that ZS is relatively new and likely could use some improvements but I have been running ultramarathons for 15 years. Most studies suggest RPE is a far better judge of effort than HR numbers as your HR is dependent on so many extrinsic factors that are out of your control. For me, ZS matches my RPE so effectively that it is somewhat scary. In a workout I will want to go harder (my brain) but my body is fatigued and I find it hard to run as fast as I want……ZS matches that and typically I am way in the yellow when my zones say aerobic.
-
-
Recent cycling to the cottage I got 135bpm aerobic threshold. Cycling back after 1.5 hour, definitely tired a lot and I got higher 140bpm threshold on that ride. I was expecting lower value on way back.
-
@Brad_Olwin I think we are on the same page. ZoneSense is related to the stress of the heart, not to a HR. Understood. ZoneSense is useful, agreed.
So showing a single HR in the app that ZoneSense calculated as a threshold is simply wrong, as this HR is not a clear divider between aerobic and anerobic phases of the workout. Therefore all conclusions made out of this wrong data point are also wrong.
 .
.