Understanding the Outdoor Watchface
-
Hey all, I realize this is probably a bit of a noob question, but I’m not particularly well versed in understanding/predicting weather patterns.
As the days have been getting shorter, I switched to the Outdoor Watchface on my 9 Baro, specifically to keep an eye on daylight and the sunset time during my afternoon runs. That watchface also wonderfully incorporates a barometric chart. My problem is that I don’t know how to interpret all that I’m looking at.
I gathered from videos and articles that high pressure generally indicates clearer, stable weather while low pressure marks more likelihood of rain or other weather hazards. So I get that part, but why does the watchface show low pressure (the more dangerous aspect) in green (green is normally good) while high pressure levels are in red (which you’d normally associate as a warning color). I’d think those should be flipped, but I assume there’s a nuance here that I’m not understanding … that maybe it’s also tied to how rapidly the pressure is changing? Something else?
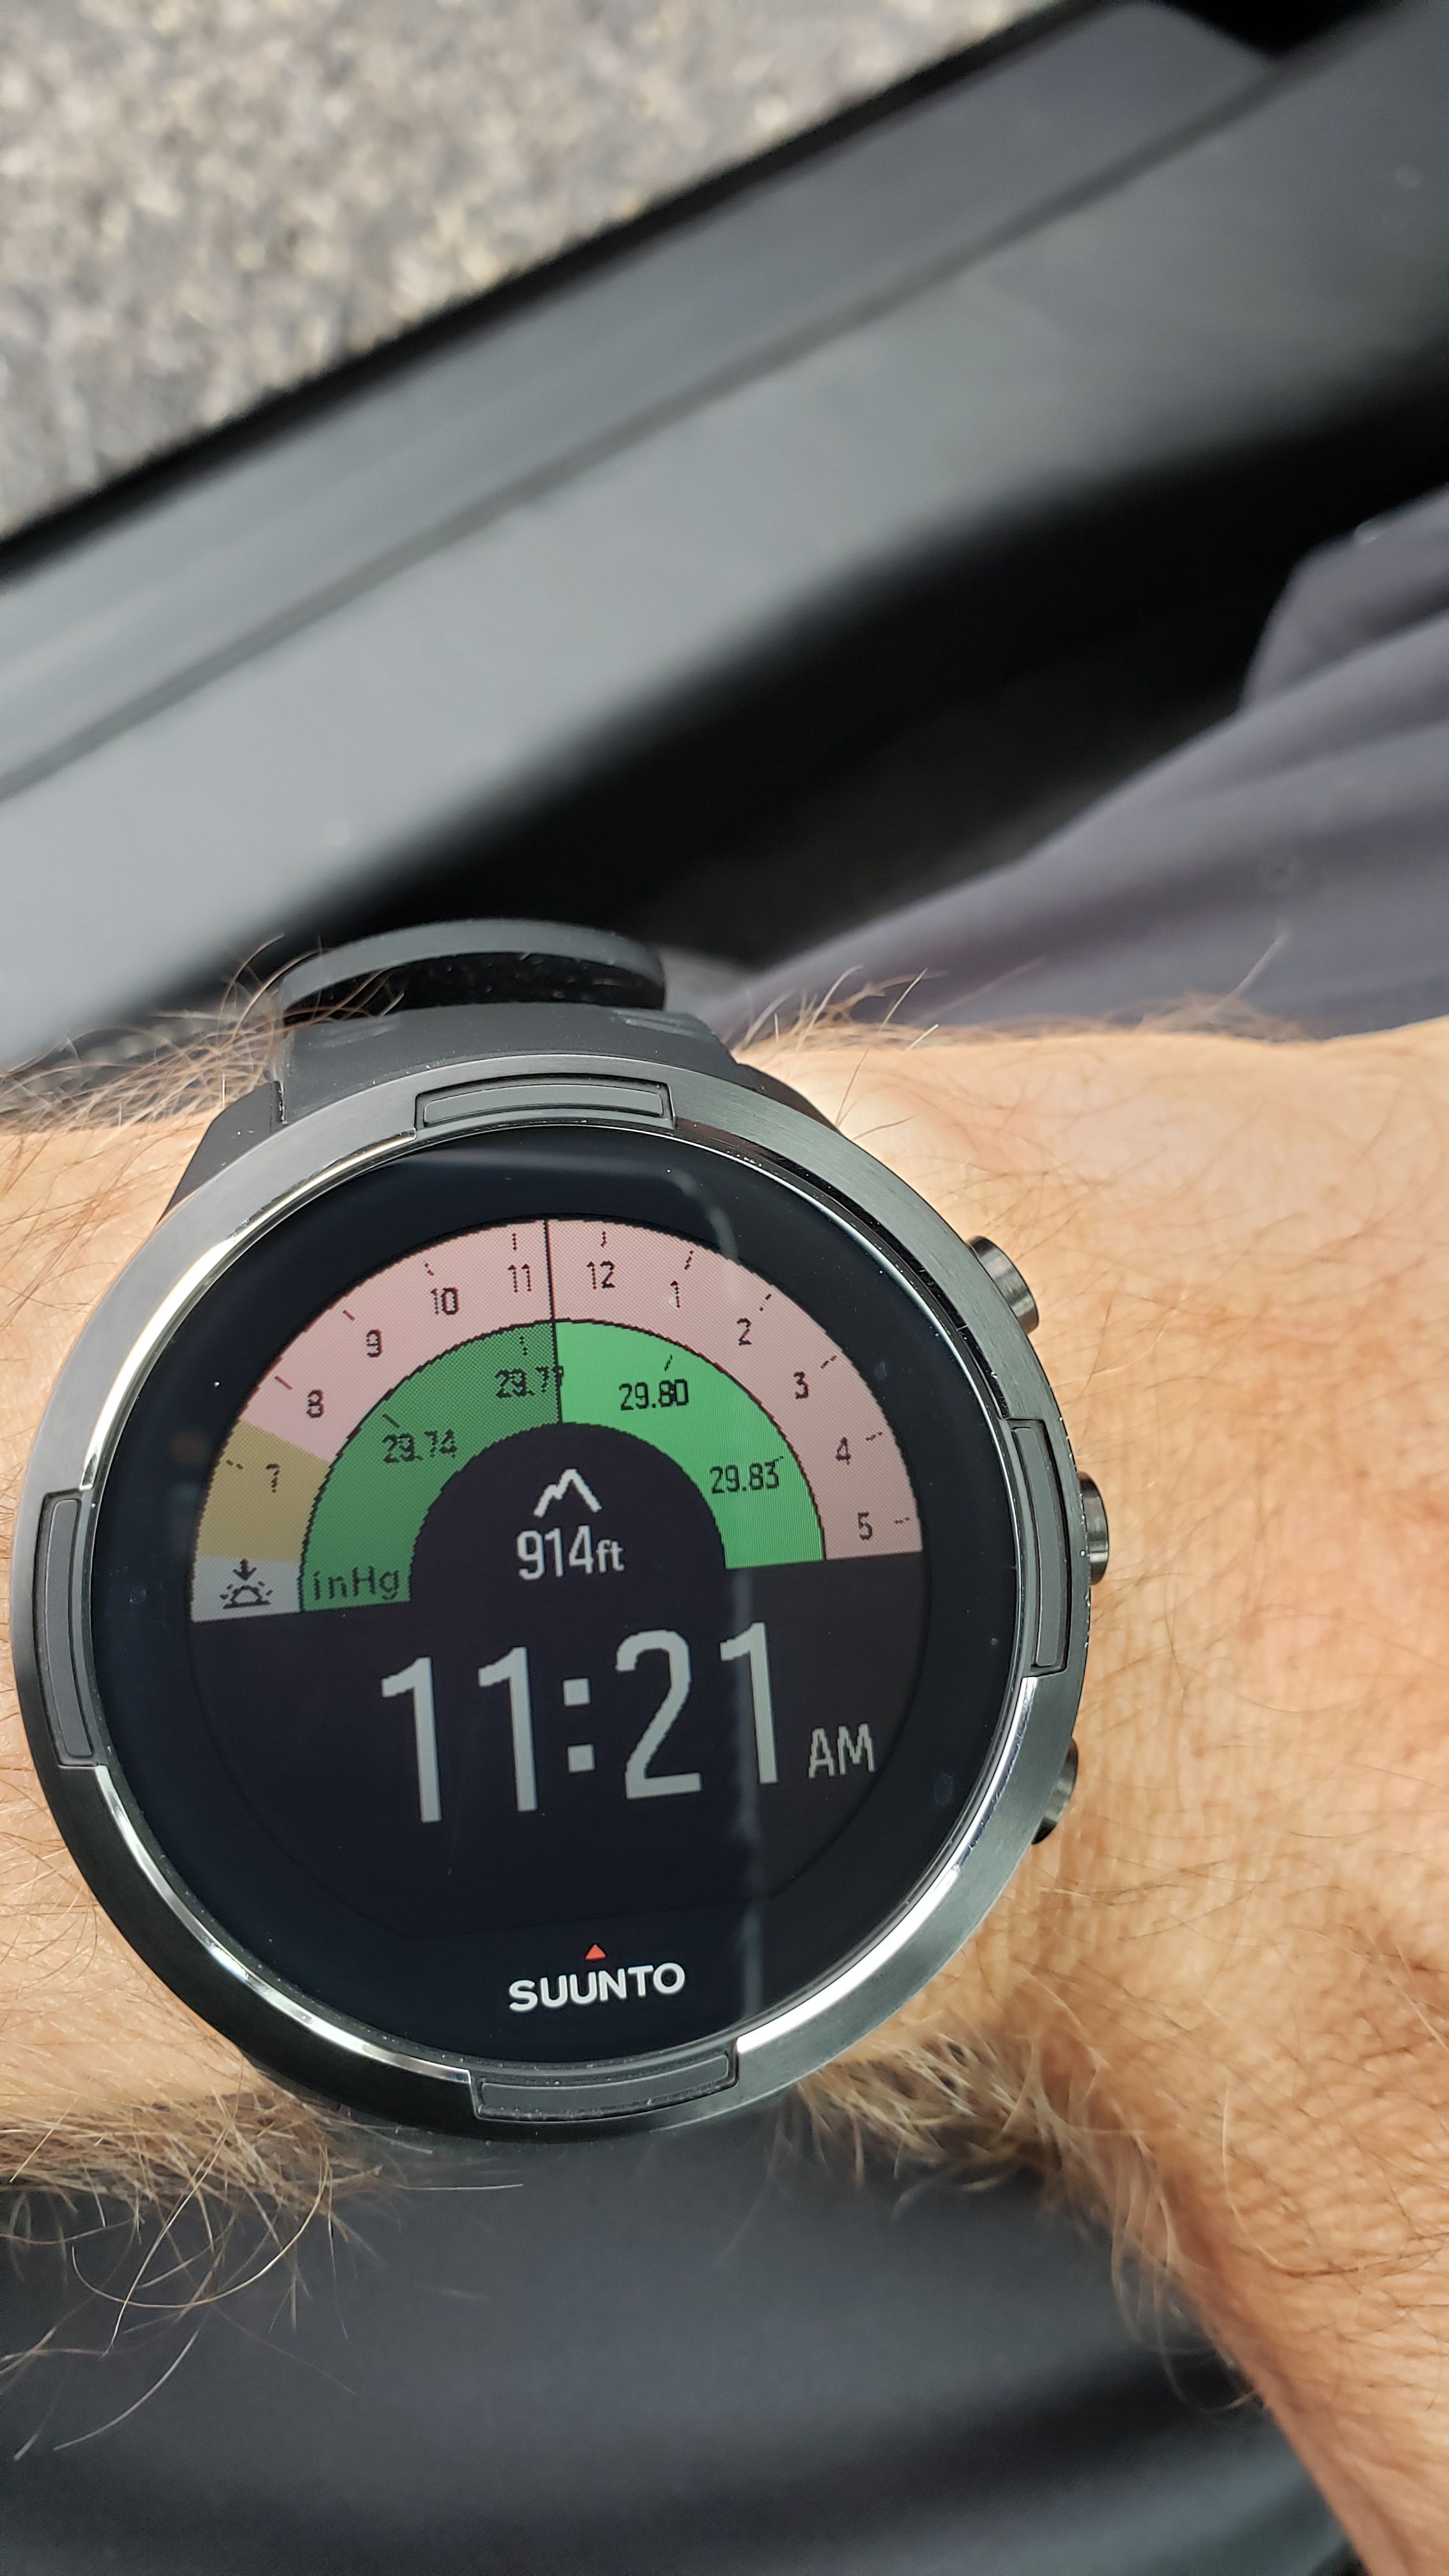
Here’s a pic showing lower pressure numbers colored green along with a middle yellow area. Not coincidentally, it began raining about 15 minutes after I snapped this.
Can someone offer guidance so I can better understand what this watchface is trying to tell me?
-
@traileyes What exactly do you mean by yellow area in the middle? The altitude icon?
Barometric pressure isn’t really exact science. Lower pressure in general means worse weather. Higher means clearer weather. Depending on the rate the pressure drops or rising this can be in a couple of hours or multiple days.
This is not guaranteed!
Try searching some information about barometric pressure and weather on the internet to learn some more.
Edit:
Maybe this helps…
https://www.artofmanliness.com/lifestyle/gear/fair-or-foul-how-to-use-a-barometer/ -
@surfboomerang Right, more my question is why the indicating color on the watchface for worse weather is green while for better weather it’s red? I feel like those should be flipped to correspond with higher pressure being green and lower pressure being red.
That’s why I wondered if there’s a nuance that I was missing, potentially related to the meaning of the watchface’s color coding.
-
@traileyes in your screenshot you have on the outer semicircle the time (in hours) of the day, and daylight. In the inner semicircle you have pressure. In the data field you have altitude.
-
So, this thread can probably be closed. I fell victim to my partial colorblindness.
My daughter just informed me that the barometer readings on the right in the graphic are in fact green (to me, the high pressure looks red and different from the low pressure). 🤪
It doesn’t help the way my brain processes these colors, but at least the reality of the color coding isn’t backward from the way I had thought it should be.
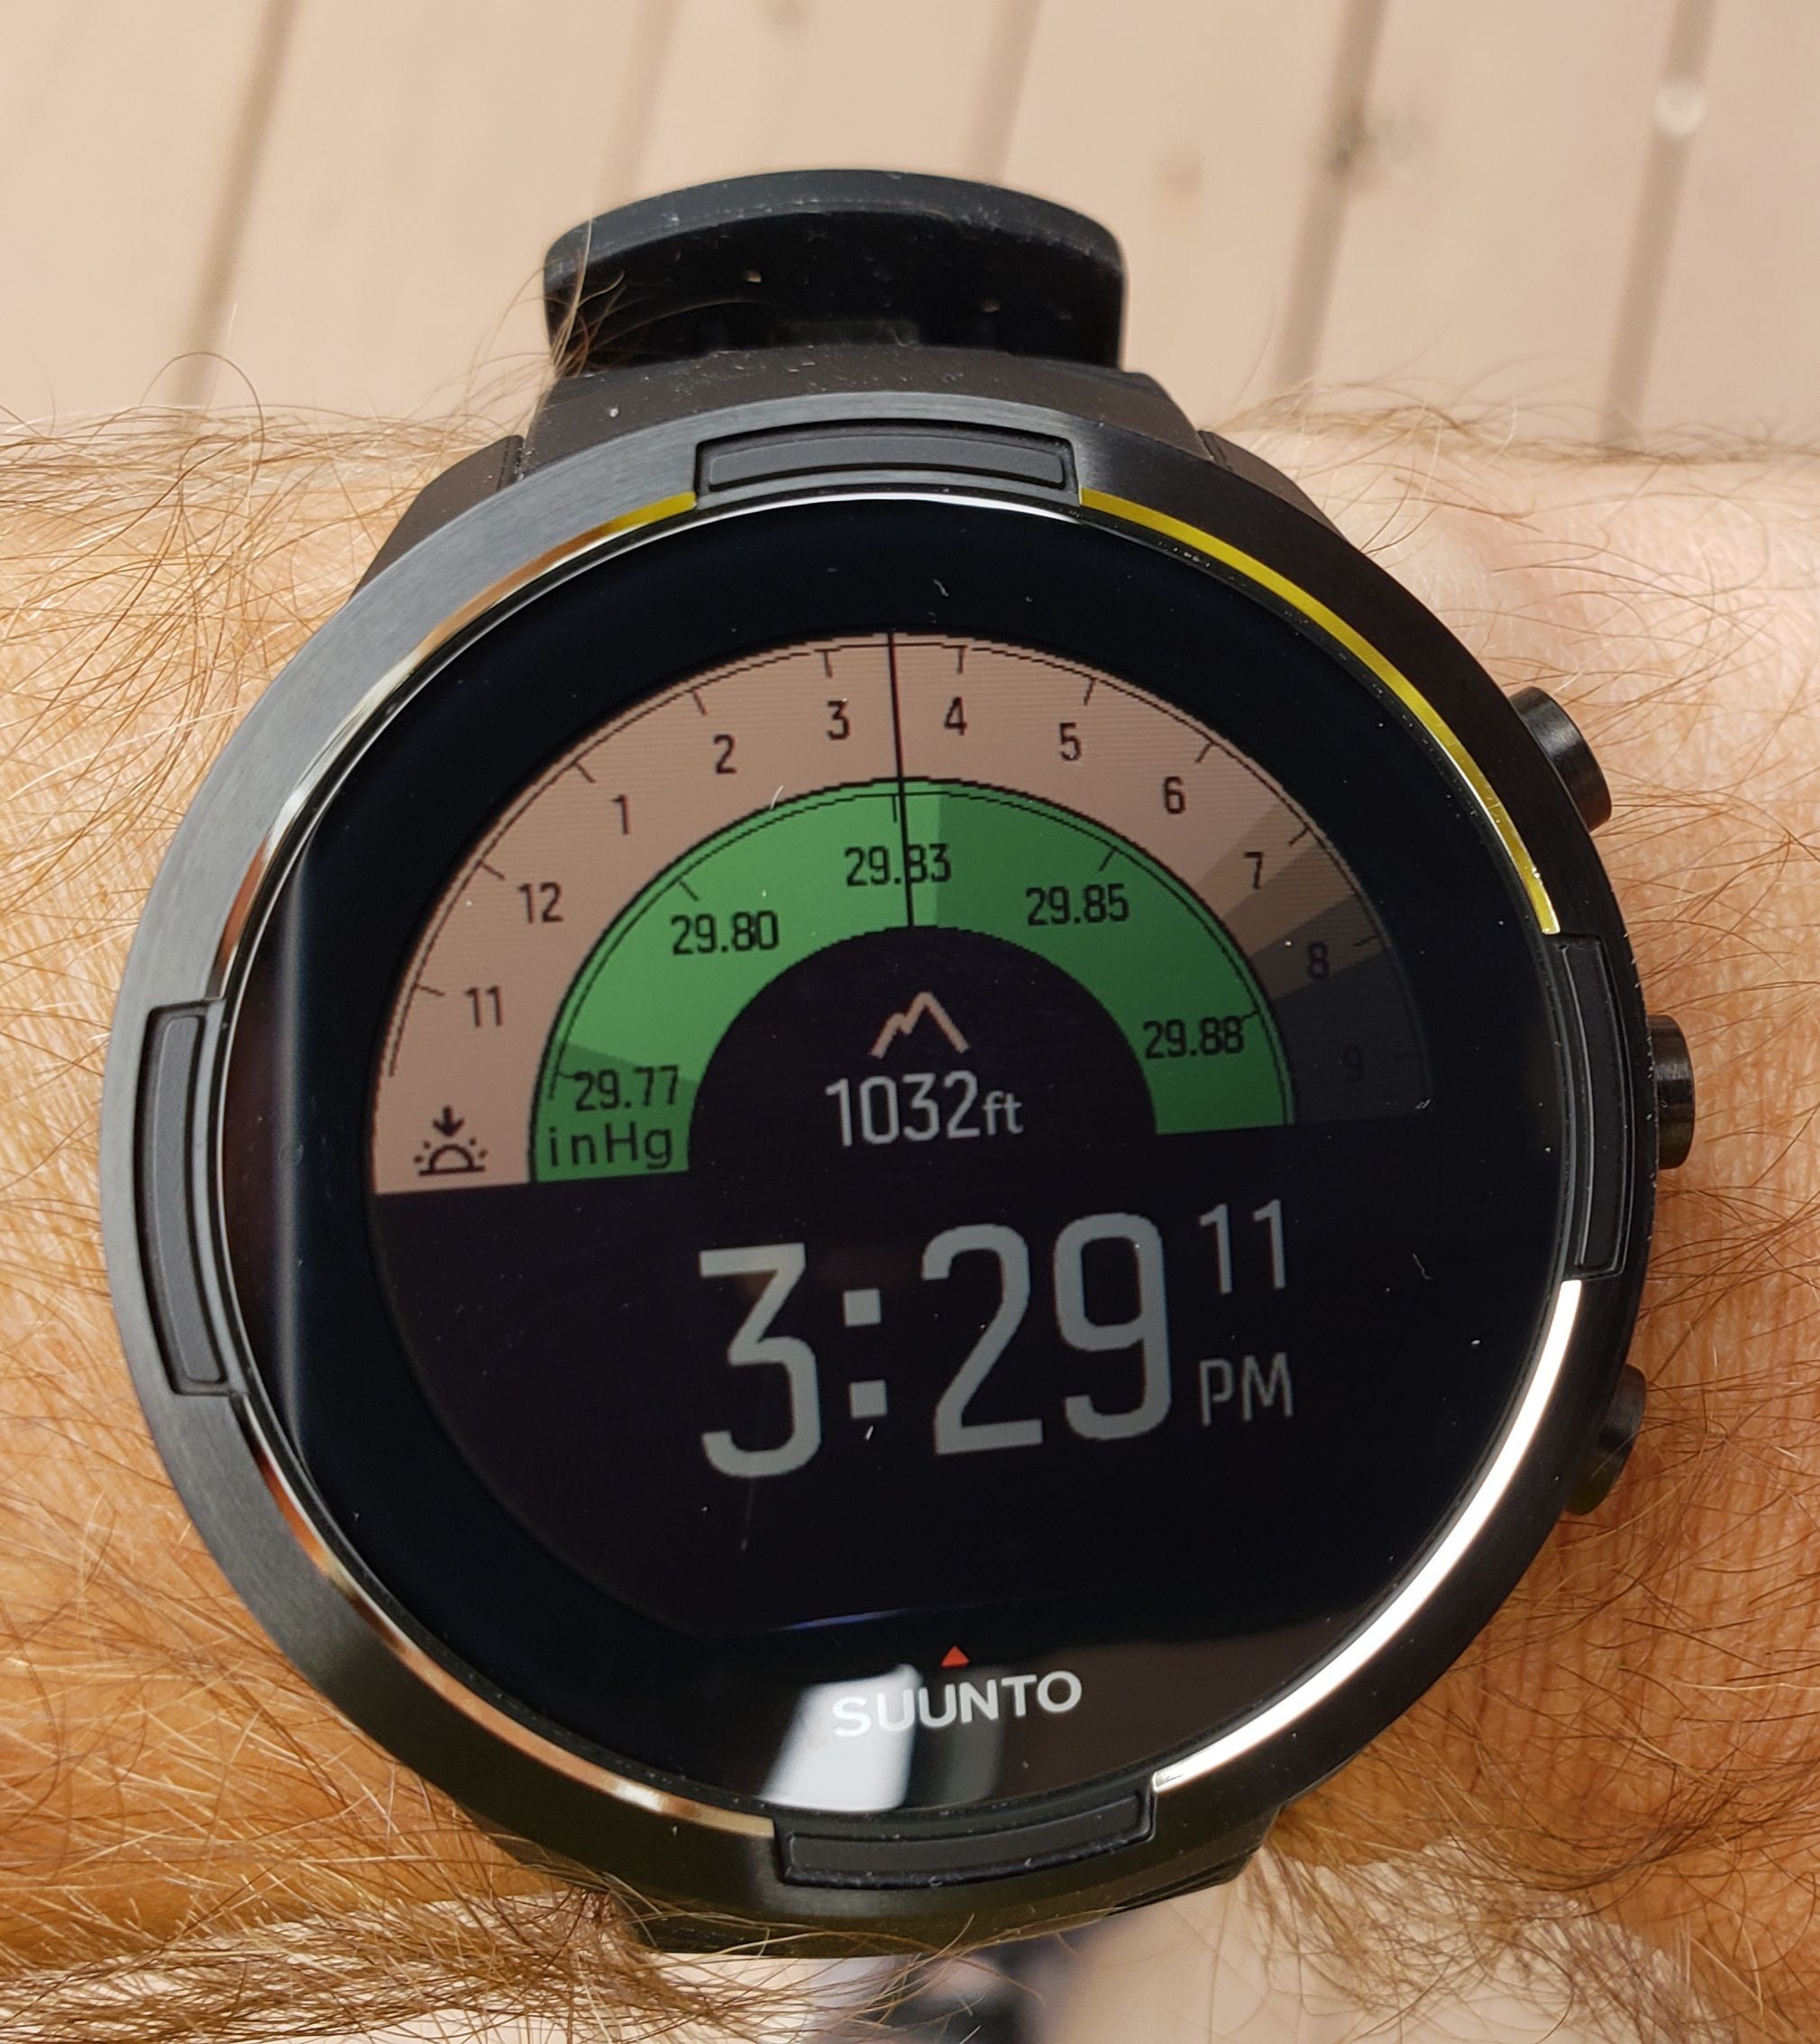
This is the pic I showed her where she explained the colors to me:
I appreciate the couple of responses I did get in an effort to set me straight

-
@traileyes oh I see it now, sorry for the confusion (and yes probably this color set is not good for color blind). In light green you would see the pressure in the last (I am not sure how many hours, maybe 6) hours, in dark green just the pressure you have not seen.
So in your screenshot looks like you reached a higher point in the last hours, then went down a little bit closer to 29.83. So pressure should be slightly going down I guess, but just a little bit.
Watch: Suunto Vertical 2 Titanium Black
Blog: isazi's home
-
@isazi it’s 100% me who needs to apologize for asking such a confusing question! Lol. Sorry about that!
To me, the barometer graph looks dark green at left, yellow in the middle, and red at right. I suspect the left and right segments are impacted visually for me by the adjacent sunrise and sunset parts of the top graph, making them look quite off to my busted eyes.
But yes, this has been an interesting day to do a couple of barometer photos. Had some light rain roll in just before the first photo, then bluer skies and heavy winds (no rain) at the time of the second pic. Temps have been chilly, then warm, and now back to chilly, so a lot has been happening today!
-
@traileyes I was going to suggest that you could change the color scheme, but found that pressure is always green - whatever the other colors are…