Exporting data from Suunto 9 Peak
-
@surfboomerang Nice! Thanks. I can definately do something with the gpx data. Found the FIT file also, I can download that with my phone but can’t do anything with it.
What I’m really looking to do is get the daily sleep data and amount of exercise and calories burnt and then follow my health improve on a spreadsheer. So far I’m just typing the daily numbers into the spreadsheet manually.
Any idea if any of that data is available, or do I have to start doing some hacking on the Android? Or do any of the third party apps support analyzing sleep heart rate patterns?
-
@lauri-rantala said in Exporting data from Suunto 9 Peak:
/…/ daily sleep data and amount of exercise and calories burnt /…/
Any idea if any of that data is available, or do I have to start doing some hacking on the Android? Or do any of the third party apps support analyzing sleep heart rate patterns?
Dailiy activity has been made available for 3rd party - https://apizone.suunto.com/docs/services/activity-and-sleep-data-api/operations/daily-activity-statistics - though I can’t name any that actually use it (doesn’t mean there aren’t any ofc.)
Not sure if tapping on a certain label and and copying files would fall under hacking Android, but creating an app dump ( https://forum.suunto.com/post/40800 & check
<internal storage>\Android\data\com.stt.android.suunto\files\stt-dumpon your phone) and exploring those sqlite tables would be my first step. There aresleepandsleepsegmentstables inamer_app.db, among others, but those are empty for me as I don’t have a watch that tracks sleep.
There’s a good chance that most datasets visible through the app can also be extracted from those sqlite files. -
@lauri-rantala said in Exporting data from Suunto 9 Peak:
What I’m really looking to do is get the daily sleep data and amount of exercise and calories burnt and then follow my health improve on a spreadsheer. So far I’m just typing the daily numbers into the spreadsheet manually.
Isn’t this exactly what Suunto App does for you…?
Otherwise, also check the integrations with the third party. It will save you a lot of time of copying data. -
@surfboomerang Yes, it is exactly what the app does, and it does it great. But I want that info on a spreadsheet. Just me and my silly taste and love of spreadsheets
")
-
I did some light hacking on the gpx files, I now get the data in a perl script to be used any way I want. I used the Perl Geo::Gpx module. Here’s a simple script that will get anyone intrested started:
#!/usr/bin/perl
# https://metacpan.org/pod/Geo::Gpx

use Geo::Gpx;
use Data::Dumper;

my $gpx= Geo::Gpx->new( input =>"suuntoapp-Walking-2021-12-19T11-28-24Z-track.gpx");

# print Dumper($gpx);

my $iter = $gpx->iterate_points();

while ( my $pt = $iter->() ) {
	print "Point: ", $pt->{lat}, ", ", $pt->{lon};
	print " Time: ", $pt->{time};
	print " Elevation: ", $pt->{ele};
	print " Heart rate: ", $pt->{extensions}, "\n";
}

my $bounds = $gpx->bounds();
print Dumper($bounds);

my $name = $gpx->name();
print $name, "\n";

my $author = $gpx->author();
print $author->{name}, "\n";
And It’ll print out like this:
Point: 60.815993, 24.789545 Time: 1639915501 Elevation: 83.0 Heart rate: 127
Point: 60.81596, 24.789502 Time: 1639915503 Elevation: 83.0 Heart rate: 124
Point: 60.815942, 24.789458 Time: 1639915505 Elevation: 83.0 Heart rate: 123
Point: 60.815922, 24.789427 Time: 1639915507 Elevation: 83.2 Heart rate: 121
Point: 60.815903, 24.789387 Time: 1639915509 Elevation: 83.2 Heart rate: 122
Point: 60.81589, 24.789348 Time: 1639915511 Elevation: 83.4 Heart rate: 120
Point: 60.815872, 24.789308 Time: 1639915513 Elevation: 83.4 Heart rate: 117
$VAR1 = {
          'minlon' => '24.767933',
          'maxlat' => '60.819635',
          'minlat' => '60.815827',
          'maxlon' => '24.789927'
        };
suuntoapp-Walking-2021-12-19T11-28-24Z
Lauri Rantala
Very simple stuff, next I’ll simply output the time and heart rate to be plotted by gnuplot. Hope this helps anyone interested, see https://metacpan.org/pod/Geo::Gpx to get started with the Perl Geo::Gpx module.
As for the daily summary, I’ll just add those manually every morning. Got nothing better to do.
-
@lauri-rantala Wrote a short tutorial, if anyone is interested in working with the gpx files on Linux and Perl. See here: http://kristitty.net/blog/how-to-access-suunto-raw-gpx-data-with-perl/
-
@lauri-rantala looks good!
Community Manager / Admin @Suunto
Creator of quantified-self.io - sync Garmin and COROS activities to Suunto, import Suunto routes, deliver Suunto routes to Garmin courses, and analyze training data in one private dashboard. -
Thanks! If there are any real hackers out here, please help me out. Here is my gpx workout plotted with gnuplot. The speed is all over the place. On the Suunto app it’s totally smooth. What’s going on here? Notice I went shopping there between 2700 and 3700 seconds.
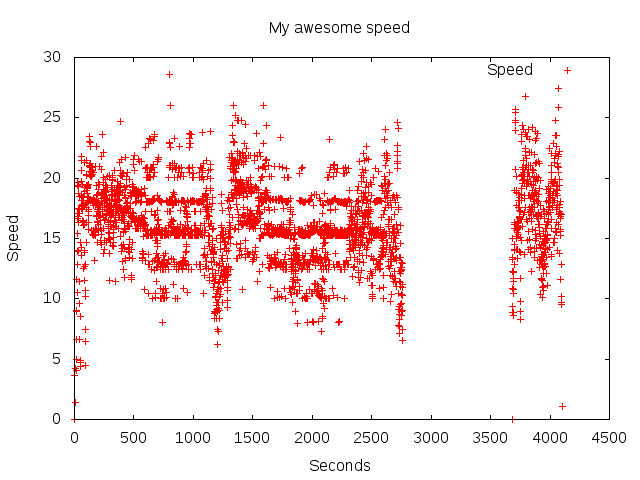
I wrote a perl script that outputs all the gpx data into whitespace separated data file, that can be used with gnuplot or any other software. It also shows the min and max and average heart rates, elevations, speed and total time and whatnot. Will upload that to some place safe in the near future. Not sure if this is the right place for “hackers”. But I’ve had a lot of fun with this so far.
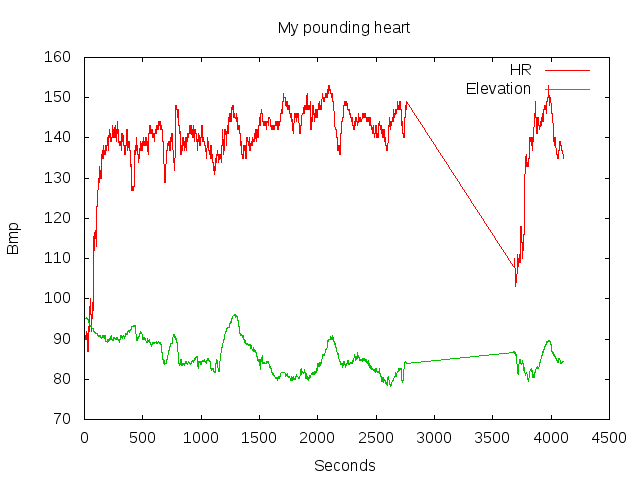
For comparison, the heart rate, elevation and positions are totally smooth, readings taken every second. Not so with the speed:
-
@lauri-rantala maybe SA is applying some smoothing algorithms.
-
@lauri-rantala I am not sure if the Suunto forum is the right place to trouble shoot your own programming or file parsing.
But anyway regarding your speed graph: what is the vertical axis meant to be in units (m/s, km/h, min/km etc)?
If you look at the gpx file using a text editor - what kind of speed information do you see there? It sould be easy to get to the source of the issue. -
@egika The Suunto gpx file only has position in latitude and longitude, time in seconds - the distance between two points has to be calculated and my script does that - no problems there, but when I calculate the speed from the distance and the seconds between the two points, the data is all over the place.
OK I’ll ask in some hackers forum, this may not be the right place. But if anyone is interested in hacking the gpx files, please comment here or in my blog, link above. Thank you all!
-
@lauri-rantala we are not applying smoothing. Gpx is not the best format. Please use fit. The reason is that gpx is xml basically and each node needs to have lat long to hold the subvalues of speed etc.
Fit is not restricted to this. You can have speed without lat long etc.
Community Manager / Admin @Suunto
Creator of quantified-self.io - sync Garmin and COROS activities to Suunto, import Suunto routes, deliver Suunto routes to Garmin courses, and analyze training data in one private dashboard. -
@lauri-rantala also I have written the sports lib. It’s in TS though but can help with all that stuff even generate the ngap
Also Thomas from elevate for Strava has a good PR open to that lib
Not sure if it helps with python, but a node J’s backend could help or a wrapper script.
Community Manager / Admin @Suunto
Creator of quantified-self.io - sync Garmin and COROS activities to Suunto, import Suunto routes, deliver Suunto routes to Garmin courses, and analyze training data in one private dashboard. -
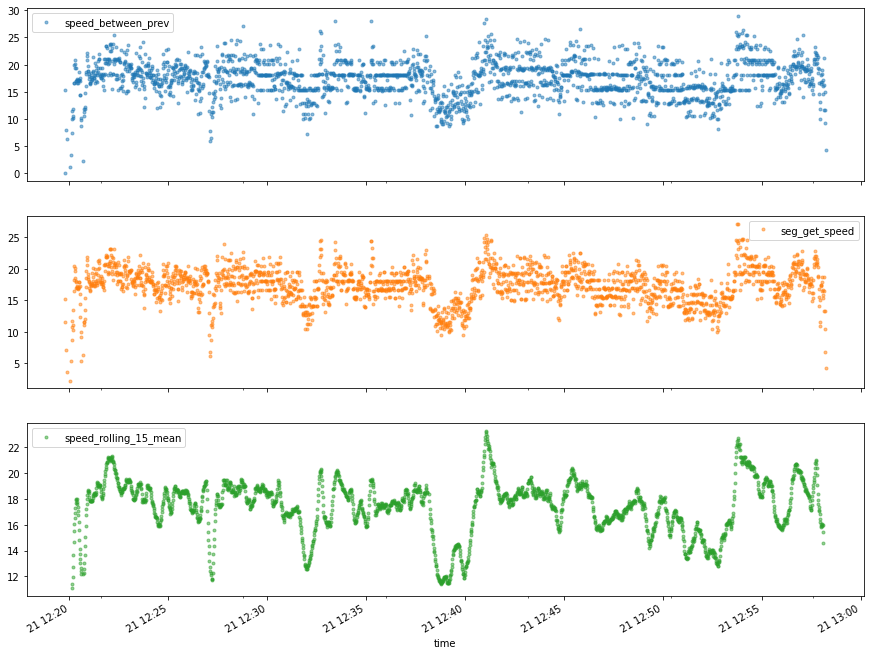
OK thanks, I’ll look into fit, but the gpx file is pretty OK. I take the average speed of 5-20 points and end up with a pretty OK plot:

The advantage with gpx is that on my Linux system I can view them with other software too. But I’ll look into fit, why not.
And my perl script gpx2plot is now available at github, if anyone is interested.
-
@dimitrios-kanellopoulos Oh and the fit format is proprietary, so not that interested. There is no fit library for perl, but there is one for gpx, so I’m pretty happy with gpx for now.
-
@dimitrios-kanellopoulos I did download the fit file, tried to convert it to gpx with gpsbabel, but that program says Unsopported protocol version 2.0 - that’s the thing with proprietary formats.
-
GPX files from Suunto App are quite heavily processed, some datapoints are dropped while others are added through interpolation, so when calculating speed from resulting GPX-points, that level of noise is kind of expected.
Though what I find interesting and bit unexpected is that level of granularity - how points are gathered around 3-2 values and forming vertical parallel lines on a chart. The way you calculate speed makes this more prominent - time difference between most points is 1 s, so if speed is calculated only by considering time & distance between current and previous point, it’s basically a dataset of distance differences between points. When calculating speed at point n through points n-1 and n+1, output would be smoother and granularity does not pop out that much, though it’s still there.
Had to see if this is something specific for GPX-generator used by SuuntoApp / SportsTracker, but GPX from 9P was only one with such a strong granularity. Nothing to worry about ofc, just interestingaf and I’m sure it’s more visible in GPX than FIT exports.
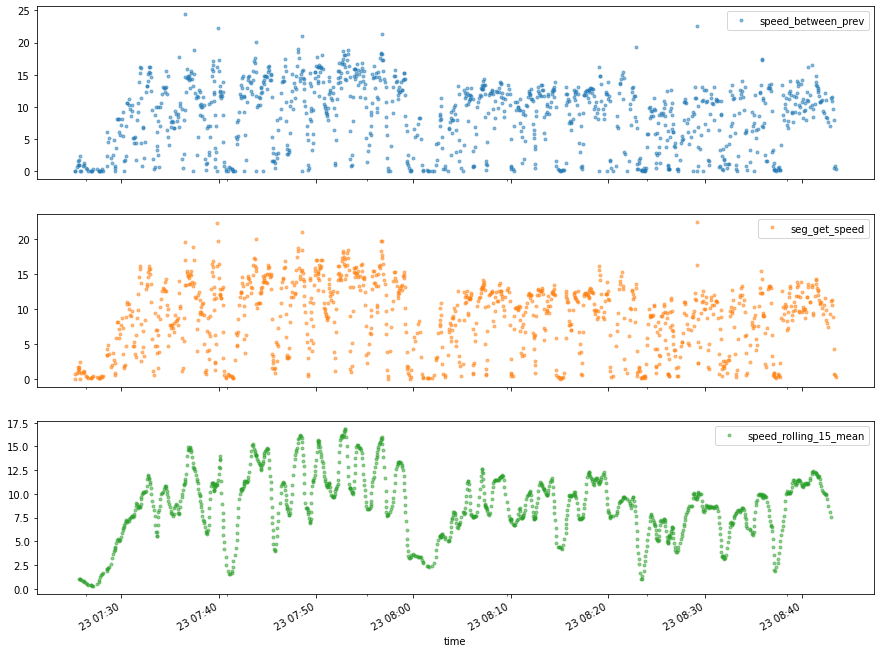
Your gpx with few different takes on calculating speed, speed_between_prev is basically same approach that you took, seg_get_speed uses n-1 & n+1 for speed at n and and speed_rollin_15_mean is centered rolling average over 15 points:
vs my F6 (ice skating, lot of stops, “smart” recording; gpx from Suunto App):
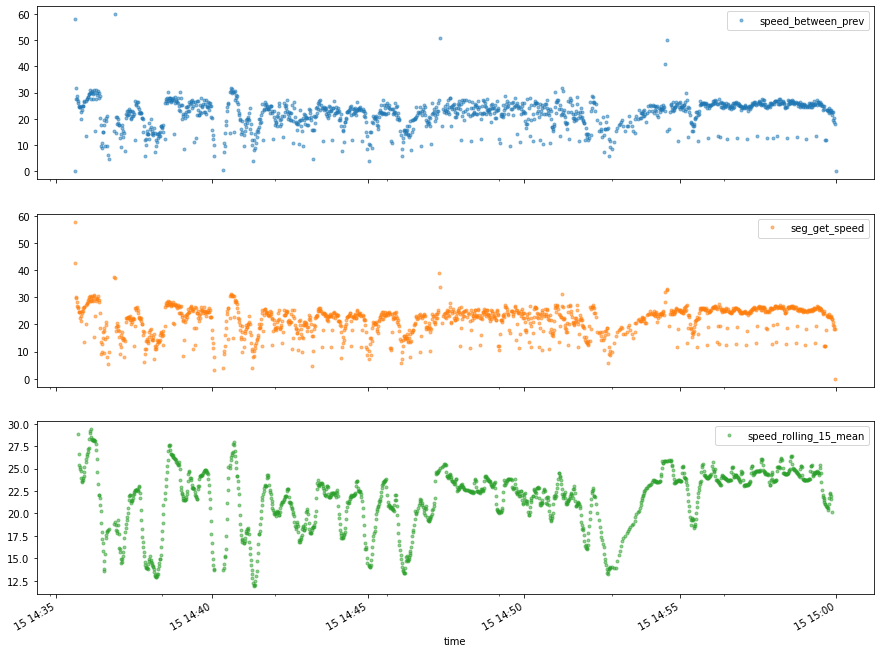
vs Ambit3P (bike commute, note those 40+ km/h artefacts; gpx from Suunto App ) :
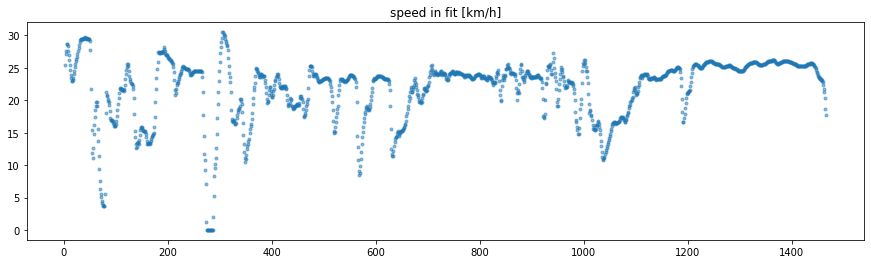
vs same A3P activity but taking speed directly from fit-file (and x is point index instead of time):
Notebook, works in Colab -
https://gist.github.com/marguslt/166fb2856bf1a16b279f4c89c14b0fbfIf I’d be interested in “raw” data, I’d certainly look for ways getting closer to dataset generated by the watch itself. So either a fit-export or perhaps a json data that’s used as an input for SuuntoApp service and stored at
<internal storage>/Android/data/com.stt.suunto/files/smlzip/on your phone.Any relatively recent installation of gpsbabel should handle fit 2.0 just fine, at least 1.7.0 works or me with SA fit-files and it was released more than a year ago. Though for up to date reference tools one should head to https://developer.garmin.com/fit/download/ , SDK includes
FitCSVTool.jarfor converting fit to csv.And there are at least 2 perl modules for fit with at least some userbase. But why aren’t those in cpan, I have no idea nor interest to find out. Though popularity curve for the language during past 10-15
20years might have some role in this …
Hello! It looks like you're interested in this conversation, but you don't have an account yet.
Getting fed up of having to scroll through the same posts each visit? When you register for an account, you'll always come back to exactly where you were before, and choose to be notified of new replies (either via email, or push notification). You'll also be able to save bookmarks and upvote posts to show your appreciation to other community members.
With your input, this post could be even better 💗
Register Login