Suunto ZoneSense
-
@Kramble Since the release is the updated version, reinstalling should work fine. I couldn’t find a way to check the exact version installed on the watch either.
-
@Łukasz-Szmigiel said in Suunto ZoneSense:
A tiny-tiny bug that I’ve found.
When using Aerobic Decoupling and ZoneSense with ZoneSense displayed, an event (alert) from Aerobic Decoupling resets ZoneSense view to a default that contains time in each zone. So when a different value were cycled by the top button, it’s back to default view.
This bug applies for all alerts unfortunately
-
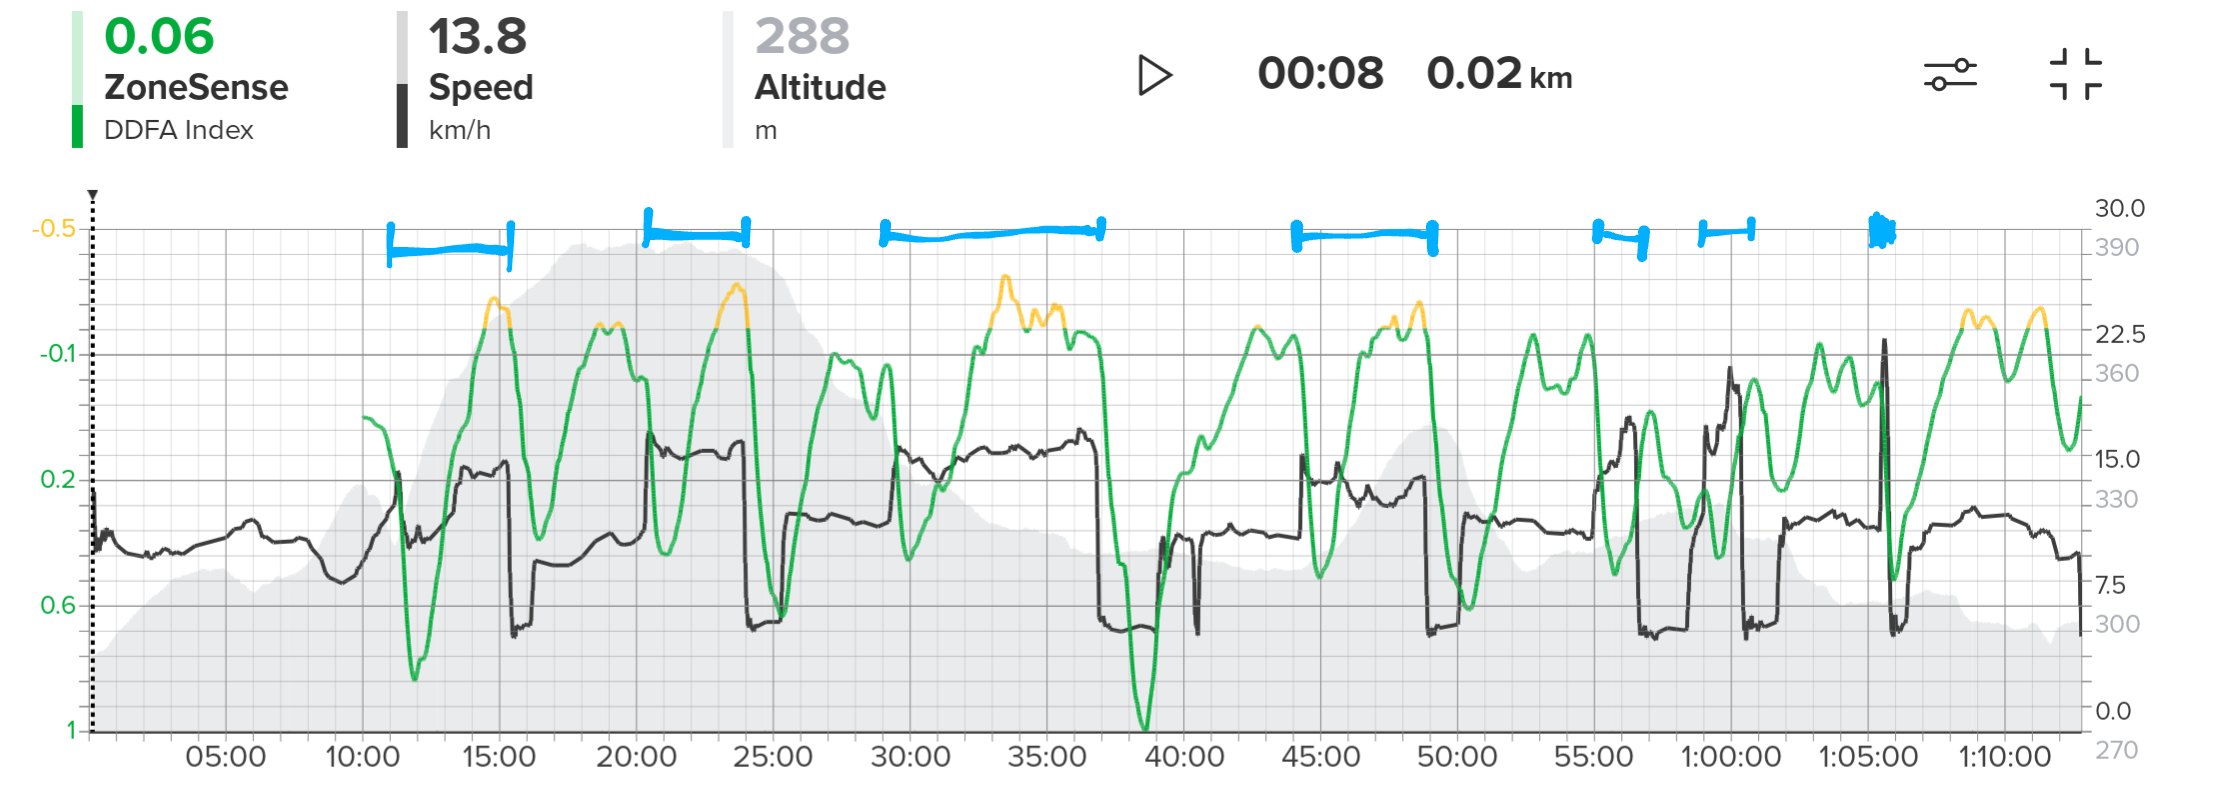
I have been using Zonesense for a few weeks now and am struggling to interpret the results. In general Zonesense seems to underestimate the effort.
For example this 50 min bike session with a few very hard intervals ending in an all out effort: https://ibb.co/km0XgKx
It is interpreted by Zonesense as a mostly aerobic effort: https://ibb.co/WxwjhgM
(The all out end is even a low aerobic effort.)Suggestions on how to interpret this are welcome. I use a Suunto Race S with a Polar H9 HR belt.
-
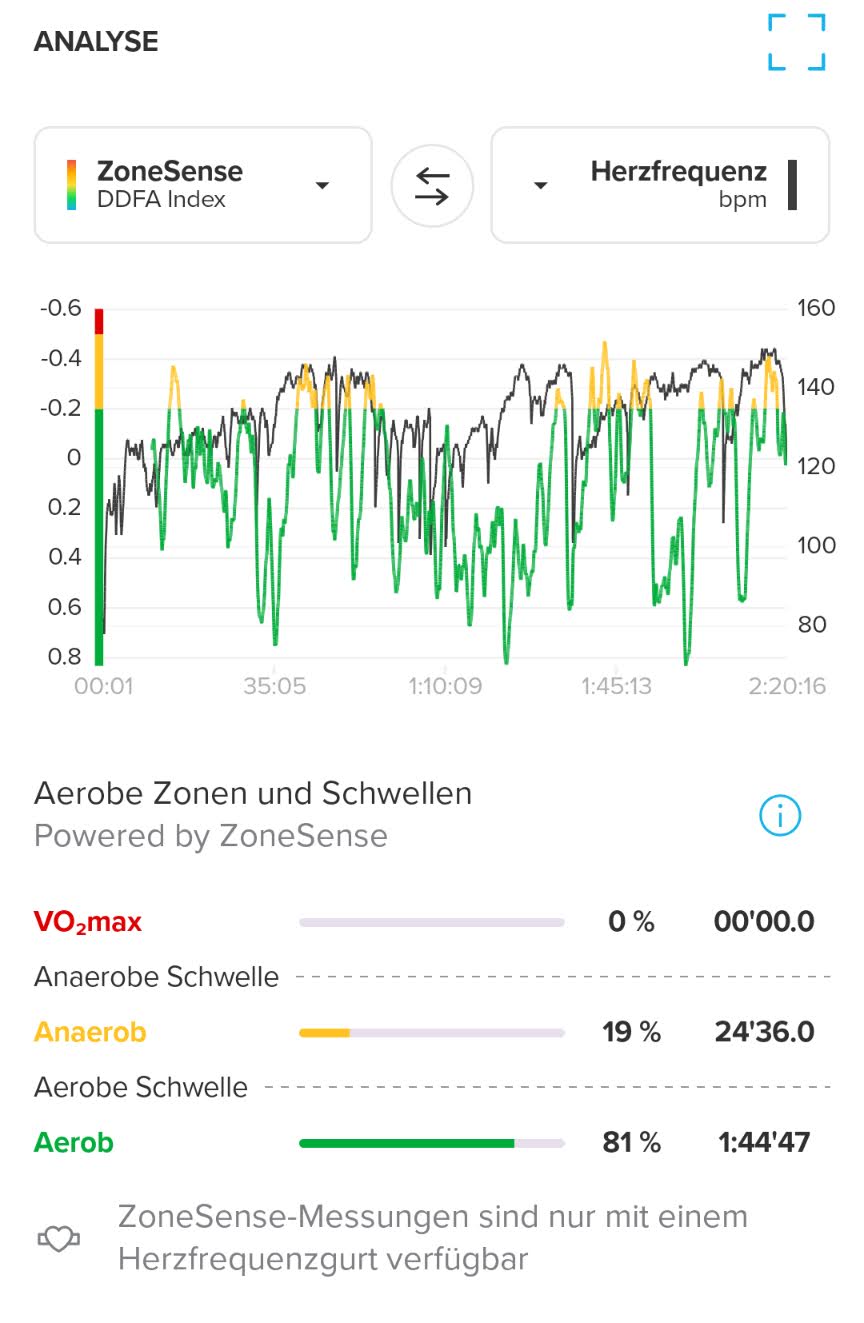
Today, for the first time, the evaluation in the app did not match the display on the vertical.
I was on the road for 2:19 hours, of which 1:23 hours were in the green zone, 0:41 hours in the yellow zone and 0:15 hours in the red zone. That’s what the Vertical showed at the end of the training session.
The hand in the outer circle also showed this correctly on the watch. The app corrected the percentage twice after I selected the ZoneSense display. First, it showed 1:05 minutes in the red zone (VO2max), then no VO2max zone at all.
The activity was tagged as “Anaerobic - hard”, but I activated the S+ app “aerobic decoupling” for the first time today, which only showed a “%” sign in the center of the display after 15 minutes (without any number), with “High” in red letters underneath. This did not change during the entire training session. I often switched back and forth between ZoneSense and aerobic decoupling.
Perhaps there is an “incompatibility” between the two S+ apps, as I have always had conclusive ZoneSense results so far?
https://www.instagram.com/moves.are.life/
Suunto Vertical Black Lime
Suunto 9 Peak Pro Black
Suunto Spartan Ultra Stealth Titanium -
@Jan-Van-de-Velde not sure if you missed it but ZS is not going to be able to represent efforts on short intervals, this was stated since day 1 as a limitation. Sustained efforts are more what ZS will work best with. I don’t bike but in running, I’ve noted that it takes ZS up to 4 mins on a hard interval to start represent real effort, so have that in mind. Also when you do sudden high changes in pace, ZS will go to green, sounds odd, but remember this isn’t HR, this is based on HRV data so it’s a different concept, we have to adjust to that.
SRS Ti
SRun (primarily road runner so testing SRun is a must ;)) -
@herlas said in Suunto ZoneSense:
@Jan-Van-de-Velde not sure if you missed it but ZS is not going to be able to represent efforts on short intervals, this was stated since day 1 as a limitation. Sustained efforts are more what ZS will work best with. I don’t bike but in running, I’ve noted that it takes ZS up to 4 mins on a hard interval to start represent real effort, so have that in mind. Also when you do sudden changes in pace, ZS will go to green, sounds odd, but remember this isn’t HR, this is based on HRV data so it’s a different concept, we have to adjust to that.
The end of his graph, something clearly went wrong
-
4 minutes seems about right from my experience today doing a fartlek run - although the one long (7:30) interval I did I was suffering at the end and it dipped a little. Else you can see fatigue at the end when I skip back in not as fast but ZS shows I’m suffering.
-
@pilleus I’ve seen similar behavior with app differing a bit from ZS summary on watch. ZS data gets analyzed in the cloud after you synced your activity to the app, so sometimes there can be small delays while that happens.
Also it has been mentioned some S+ app have issues when using along size ZS app, climb app was mentioned and now the one you said might be another. Due to how important ZS is for Suunto, I’d bet they’re already looking at it
 .
. -
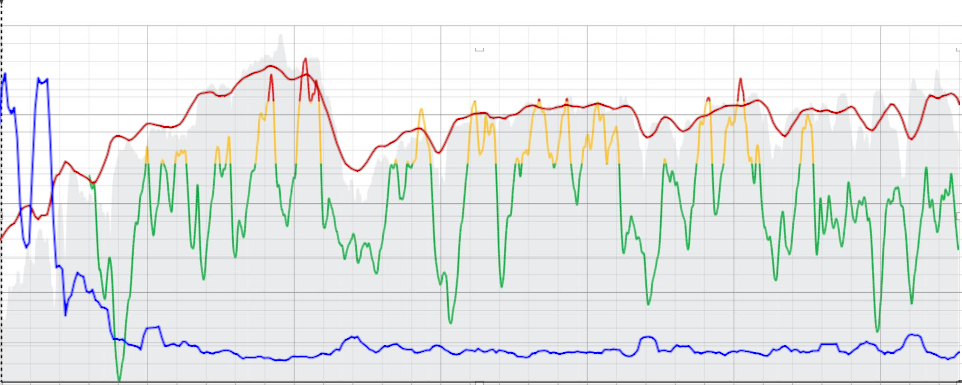
A ride on the singlespeed, 10 minutes of easy riding in with stops at the traffic lights, then a continuous increase up to km 17, felt very hard towards the end. ZS also indicated this well, although it took a long time before the red zone was briefly reached.
The return trip was brisk, but not as hard. All in all, however, a conclusive result, the training was tagged with VO2max. I once recorded the hrv (rmssd) measured in parallel and tried to integrate it into the graph, which was not quite possible as the points of the recording were not identical. The red line is the heart rate, nearly identical with the background picture of the ZS chart. The blue line the hrv.
But I think you can see from the graph that the higher the heart rate, the lower the hrv. In a few places I think I can see that the green line of ZS drops off where the blue line of hrv rises slightly. So there seems to be a correlation, but it’s also related to the heart rate.
And what you can see is that ZS is also very strongly influenced by the course of the heart rate, even if this is repeatedly denied. However, this can be different every day.
Just interested. Next time I’ll take a look at the live data from the hrv recording in parallel with the live display from ZS - smartphone next to the Vertical on the handlebars.

-
@pilleus you might be falling in the case of overanalyzing the graphs
 .
.In my case I keep it simple, even Suunto says it in one of the videos, don’t really pay attention to patterns within the same color, green is green, yellow… Etc.
There are was a great comment shared by @Brad_Olwin I think, where he said something along the lines of, 30 or 60 mins of HRV data contain more data points than whole # of sand grains in the Sahara, so short version is, hrv is complex.
-
@herlas said in Suunto ZoneSense:
@pilleus you might be falling in the case of overanalyzing the graphs
.No, I don’t think so. I am just interested in the way the algorithm is working.
Sometimes I get clear numbers of aerobic and anaerobic thresholds, after the same training a few days later with an identical graph in ZS I do not get it.
And the fact that the watch is showing two or three times within an activity of 2,5 hours a constant up to the red zone followed by a rapid down to the lowest green zone. Not visible in the app afterwards.
That’s what I try to understand.
-
@pilleus There may be some app vs. watch discontinuity. I am using this enough I will ask Suunto about this, it would not be surprising.
-
I’ve noticed I don’t always see the ZS interpreted LT1 and LT2 HR values in the zones diagram and I assume that means it agrees with what I already have set for my HR zones.
I also note in the FAQ Suunto do say that every activity with an HR belt contributes to a personalised baseline tuning and I think it fair to suggest this analysis is done on Suunto servers, not on the watch. So the watch is effectively always going to be one activity behind the app in terms of calculated baseline and the resulting ZS graph data.
Chances are, the suuntoplus app is going to be using a simplified approximation algorithm based on tuning values sync’d from the analysis of previous runs to show you “live” data. I honestly don’t see the watch app crunching all the data for 50 or more time period buckets of vector transformations as needed for the full DDFA.
-
@far-blue said in Suunto ZoneSense:
I also note in the FAQ Suunto do say that every activity with an HR belt contributes to a personalised baseline tuning and I think it fair to suggest this analysis is done on Suunto servers, not on the watch. So the watch is effectively always going to be one activity behind the app in terms of calculated baseline and the resulting ZS graph data.
If this is the case and the baseline recalculated after the activity on Suunto servers is not synchronized into the watch, then the live display on the watch would be pointless for me …

https://www.instagram.com/moves.are.life/
Suunto Vertical Black Lime
Suunto 9 Peak Pro Black
Suunto Spartan Ultra Stealth Titanium -
@pilleus I don’t expect the difference will be massive as this would only be fine tuning. But if you are ill or fatigued or some other short-term / acute variation in your physical state then maybe the live data will be a little out. There could also be artefacts caused by the approximations in the maths I suggested (without any evidence, just me opinion) in the live data you can learn to ignore.
-
Today, both on the vertical and afterwards in the Suunto app, ZS was identical to my feeling and effort on the uphills on the bike. It doesn’t have to be any better …

As with the heart rate, the delay cannot be compensated for, as the data analysis and display take time. It’s okay for me and I can see it on the hand of the outer ring on the watch when the effort increases during uphills.
-
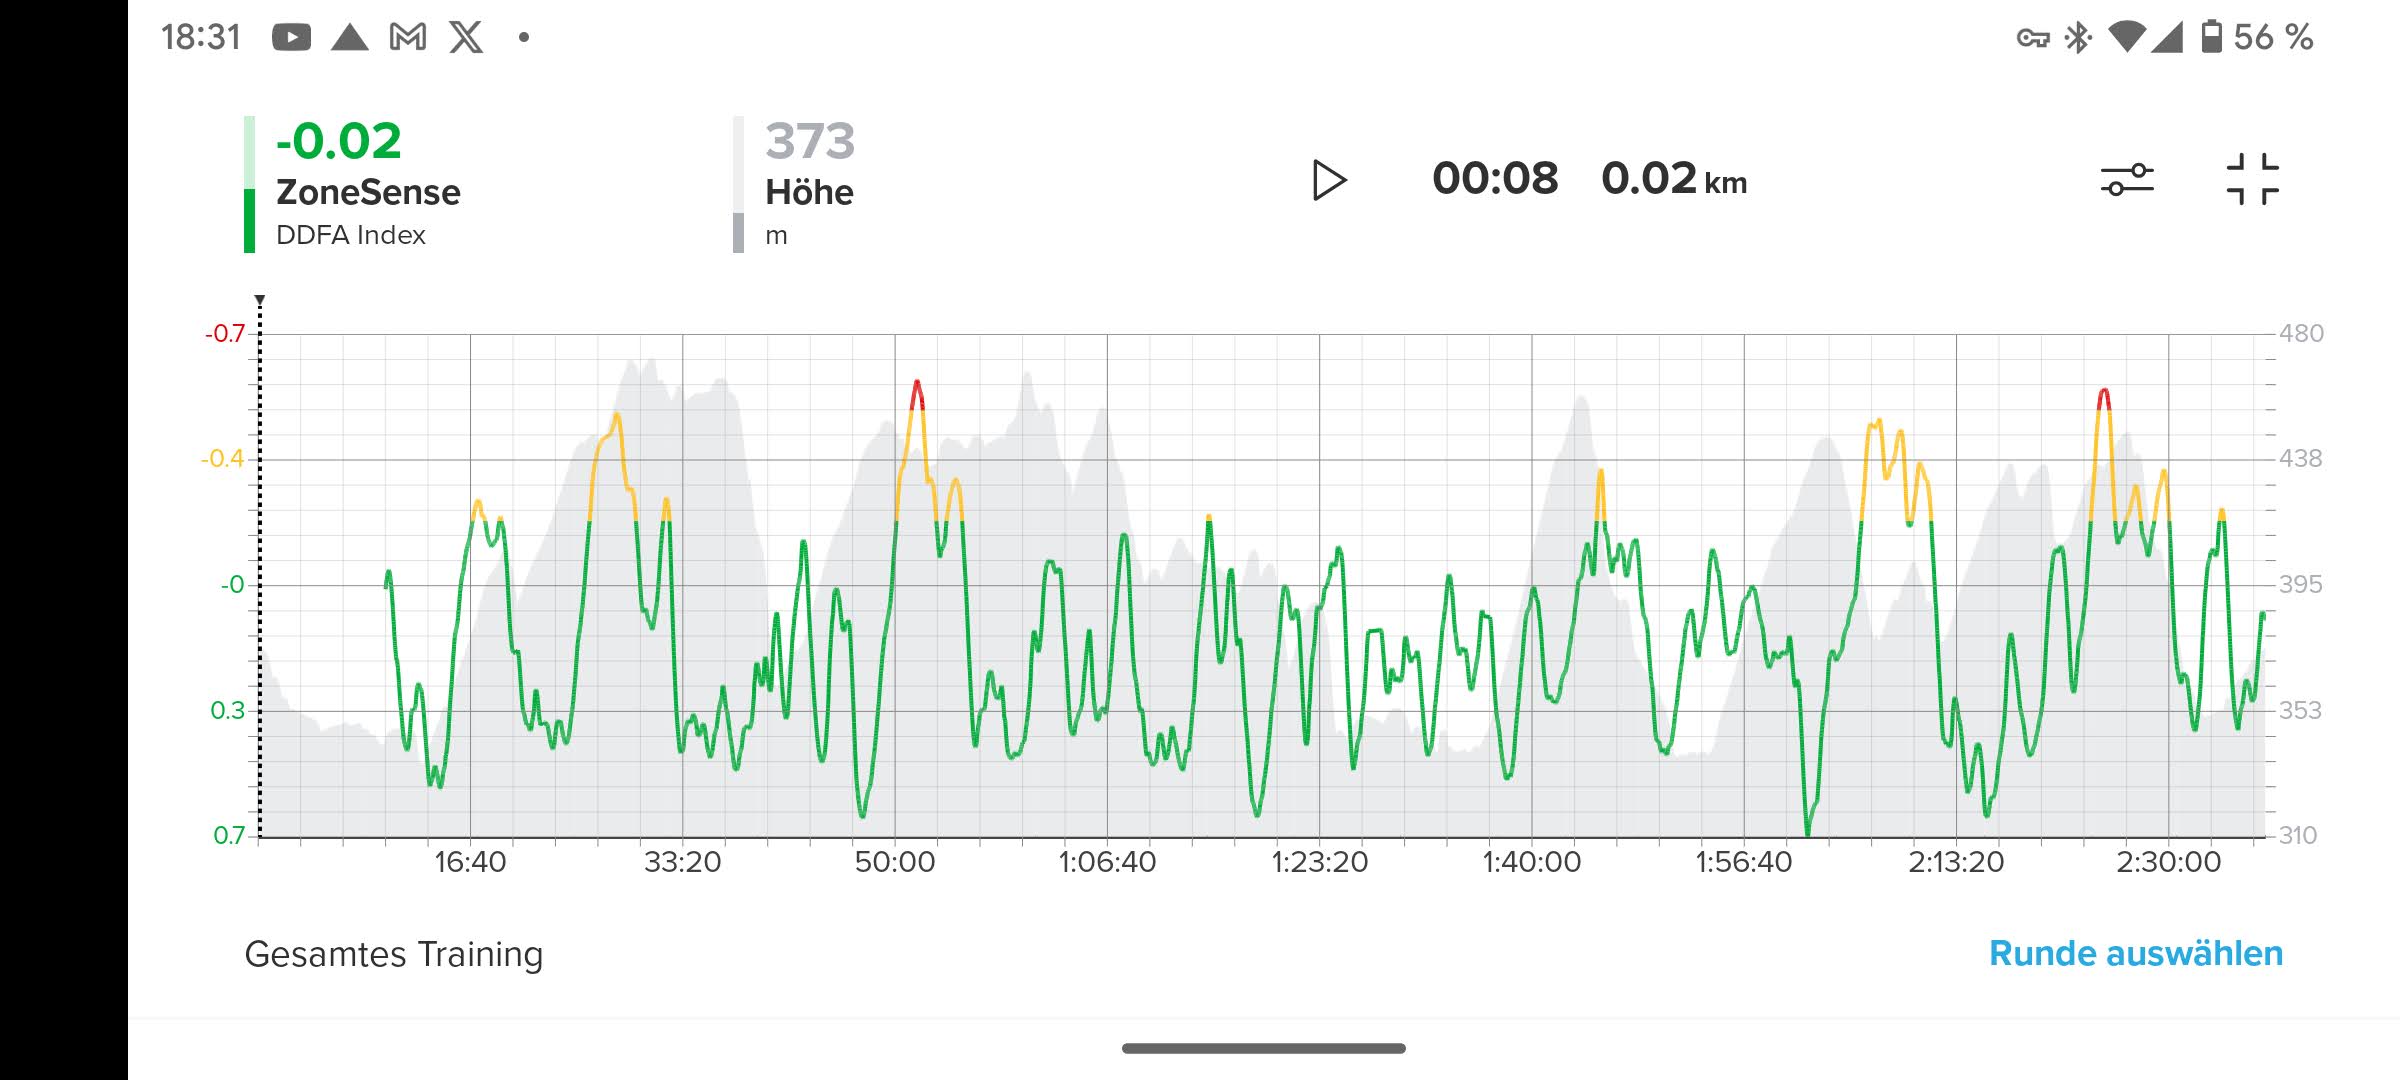
I am still having trouble interpreting my zone sense results. Especially with long intervals, the DDFA index is the opposite to what I would expect and the thought of guiding my effort in real time using ZS is unreasonable. Today’s effort is typical of what I am seeing. Does this imply some non-standard physiology, a potential underlying pathology, or am I simply misunderstanding the results?
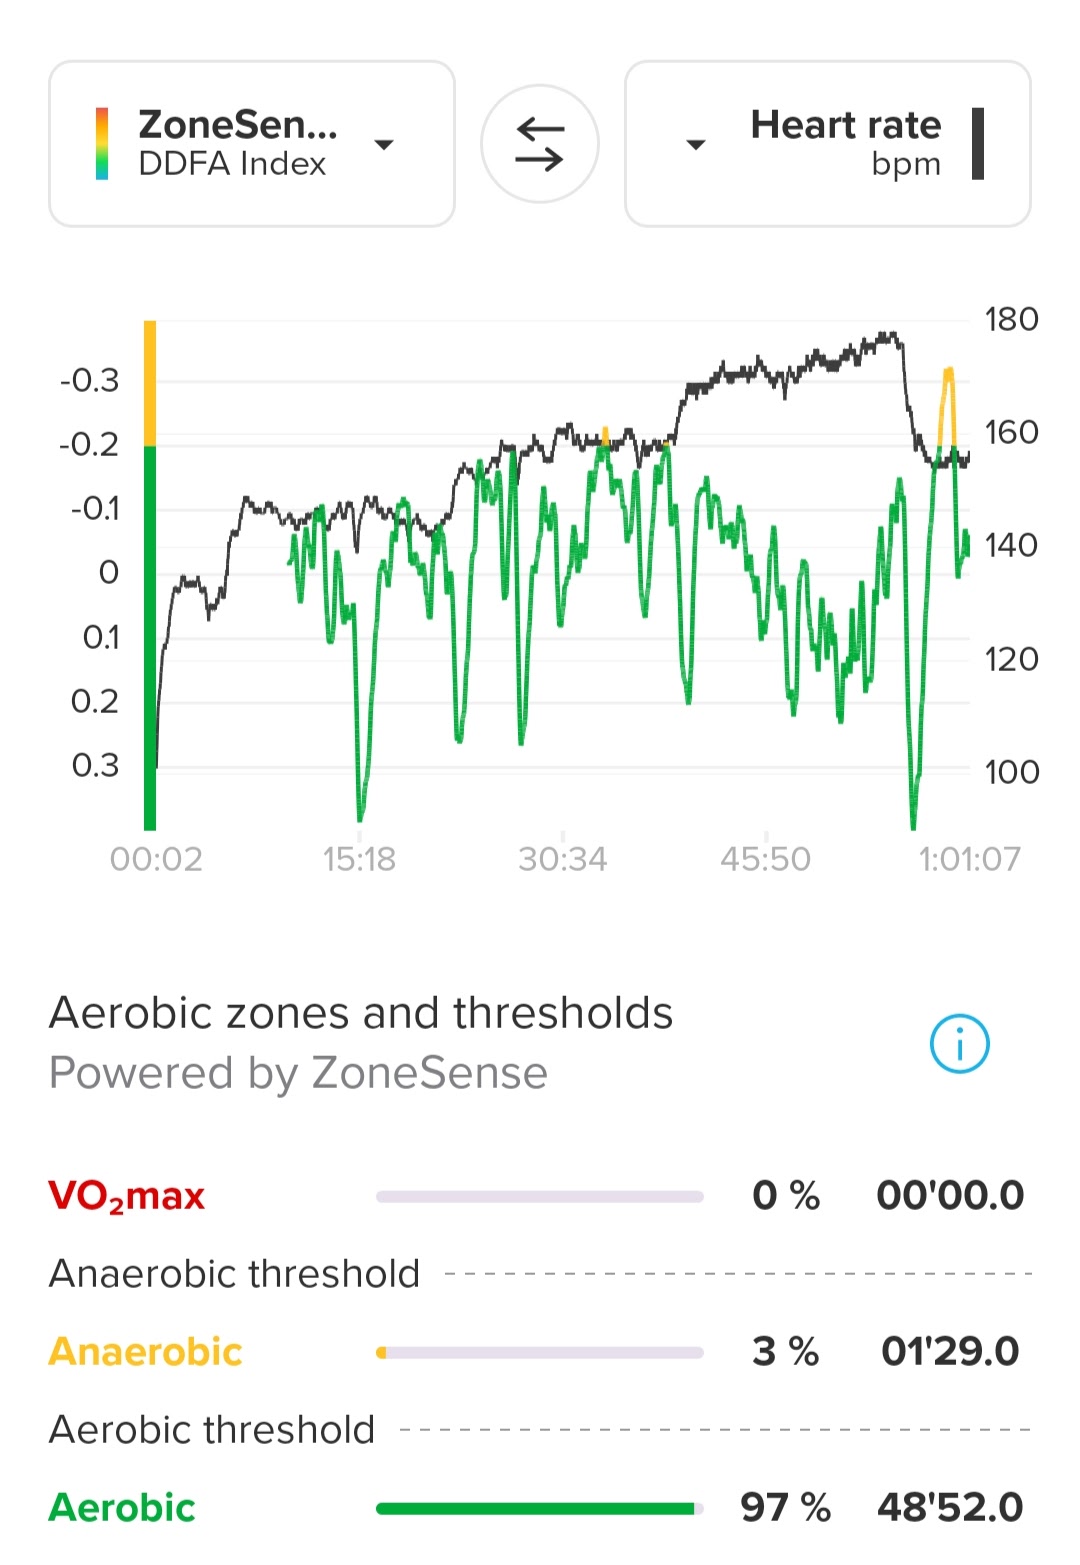
Suunto M5, Quest, Trackpod, A2S, SSU, S9B, S9P, Race
Garmin 305, 60, 405, Fenix 2, 945, 955
Polar M430, Vantage V -
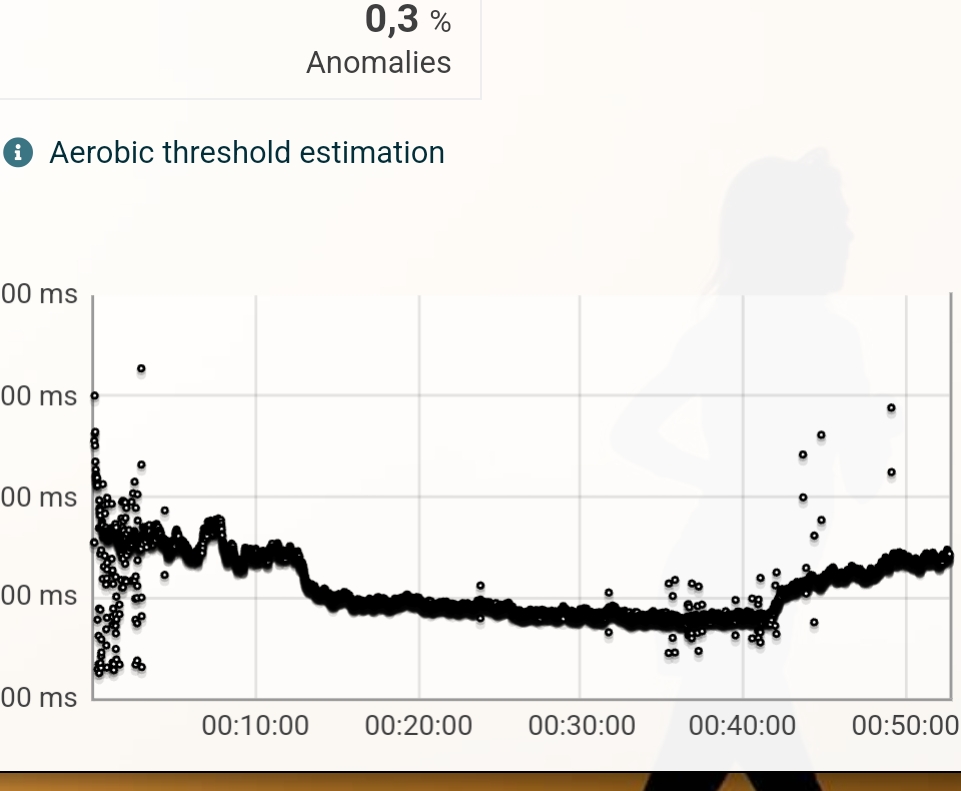
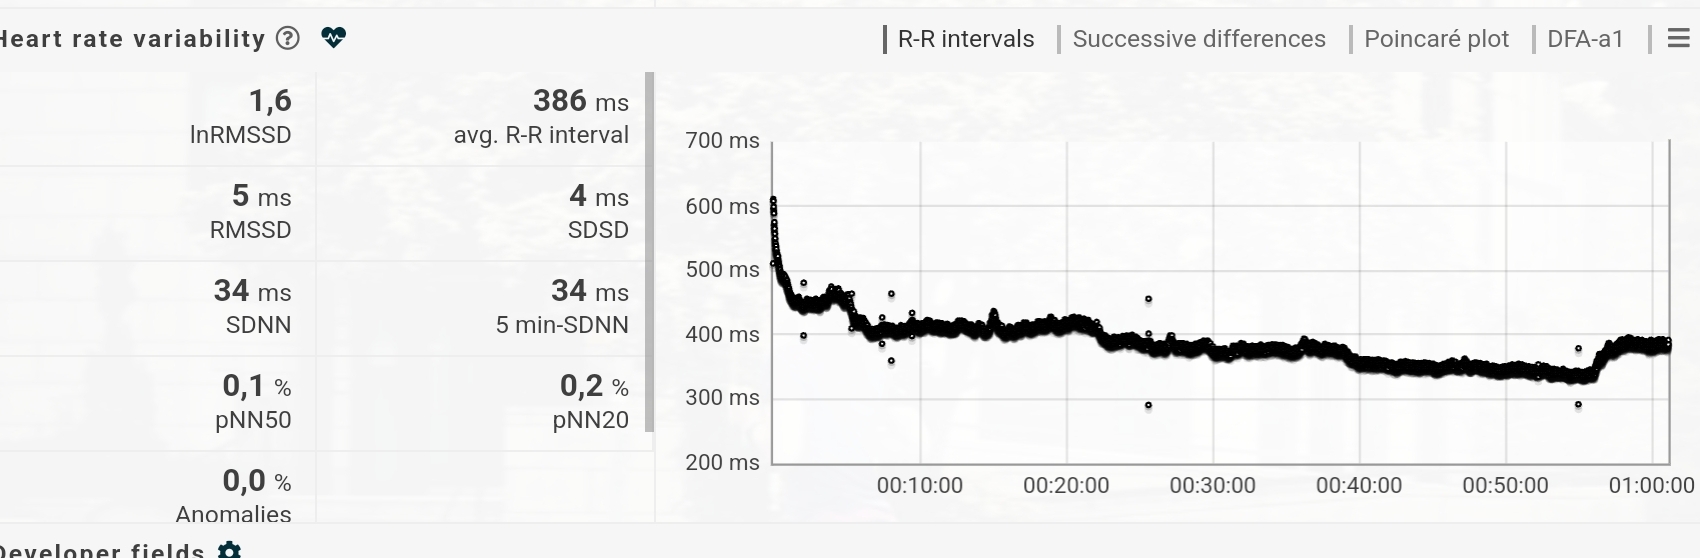
@althaea35 that’s odd, what sport and what HR strap are you using? There have been known cases where either a bad strap or sensor are not producing good quality HRV data. You can try to look at the % of anomalies in HRV recordings via Runalyze (https://runalyze.com)
E g. (0.3% is good)
-
@herlas Thank you for your response.
I have been monitoring the quality of the data using Runalyze for all runs, and the results have been good with low noise. Generally, I use the Suunto MoveSense strap, but have tried switching it up with a polar H10 for a few sessions to vary the data sources. The results show consistent trends, with a number of long threshold intervals and progression runs in the bag (I have posted results from another session earlier in this thread).
I am interested if there are outliers (physiologically) or maybe my baseline data is corrupt?
-
@althaea35 : I have the same kind of results in my graphs.
Would like to understand this also.
Using a polar H10 strap.
Hello! It looks like you're interested in this conversation, but you don't have an account yet.
Getting fed up of having to scroll through the same posts each visit? When you register for an account, you'll always come back to exactly where you were before, and choose to be notified of new replies (either via email, or push notification). You'll also be able to save bookmarks and upvote posts to show your appreciation to other community members.
With your input, this post could be even better 💗
Register Login