Zonesense difficult to understand
-
@luke55 said in Zonesense difficult to understand:
Your max HR is quite high, how did you determine it ?
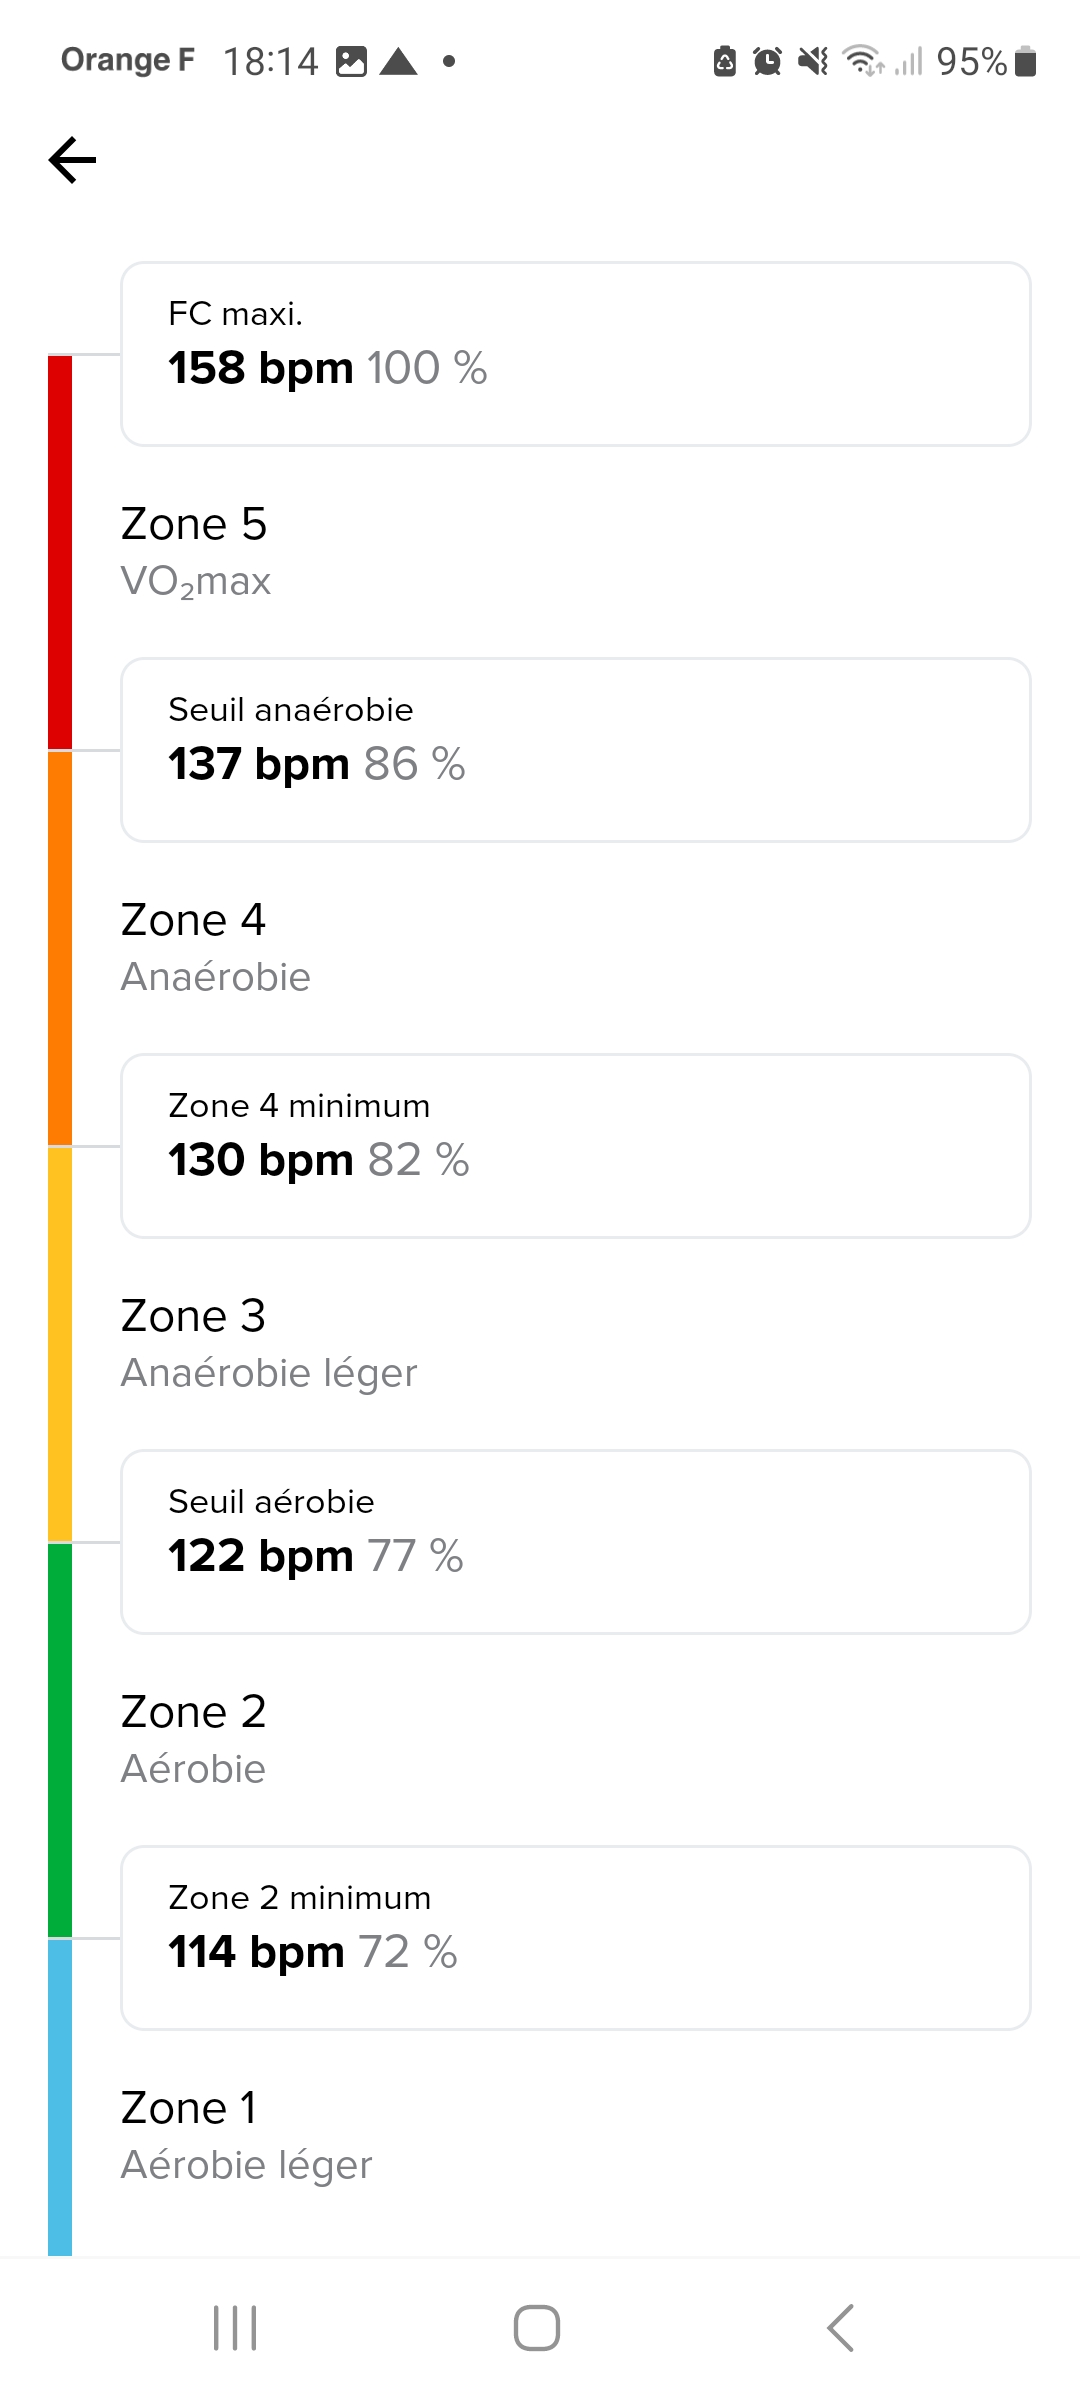
For me, I used the formula 220 minus age, and increased it a bit, which gave me 158.
Zone values computed by the watch derived from this value, this why you find them so low.Given the sensations I have at 150 bpm, I can’t imagine trying to push higher, so a max HR of 158 seems reasonable for me.
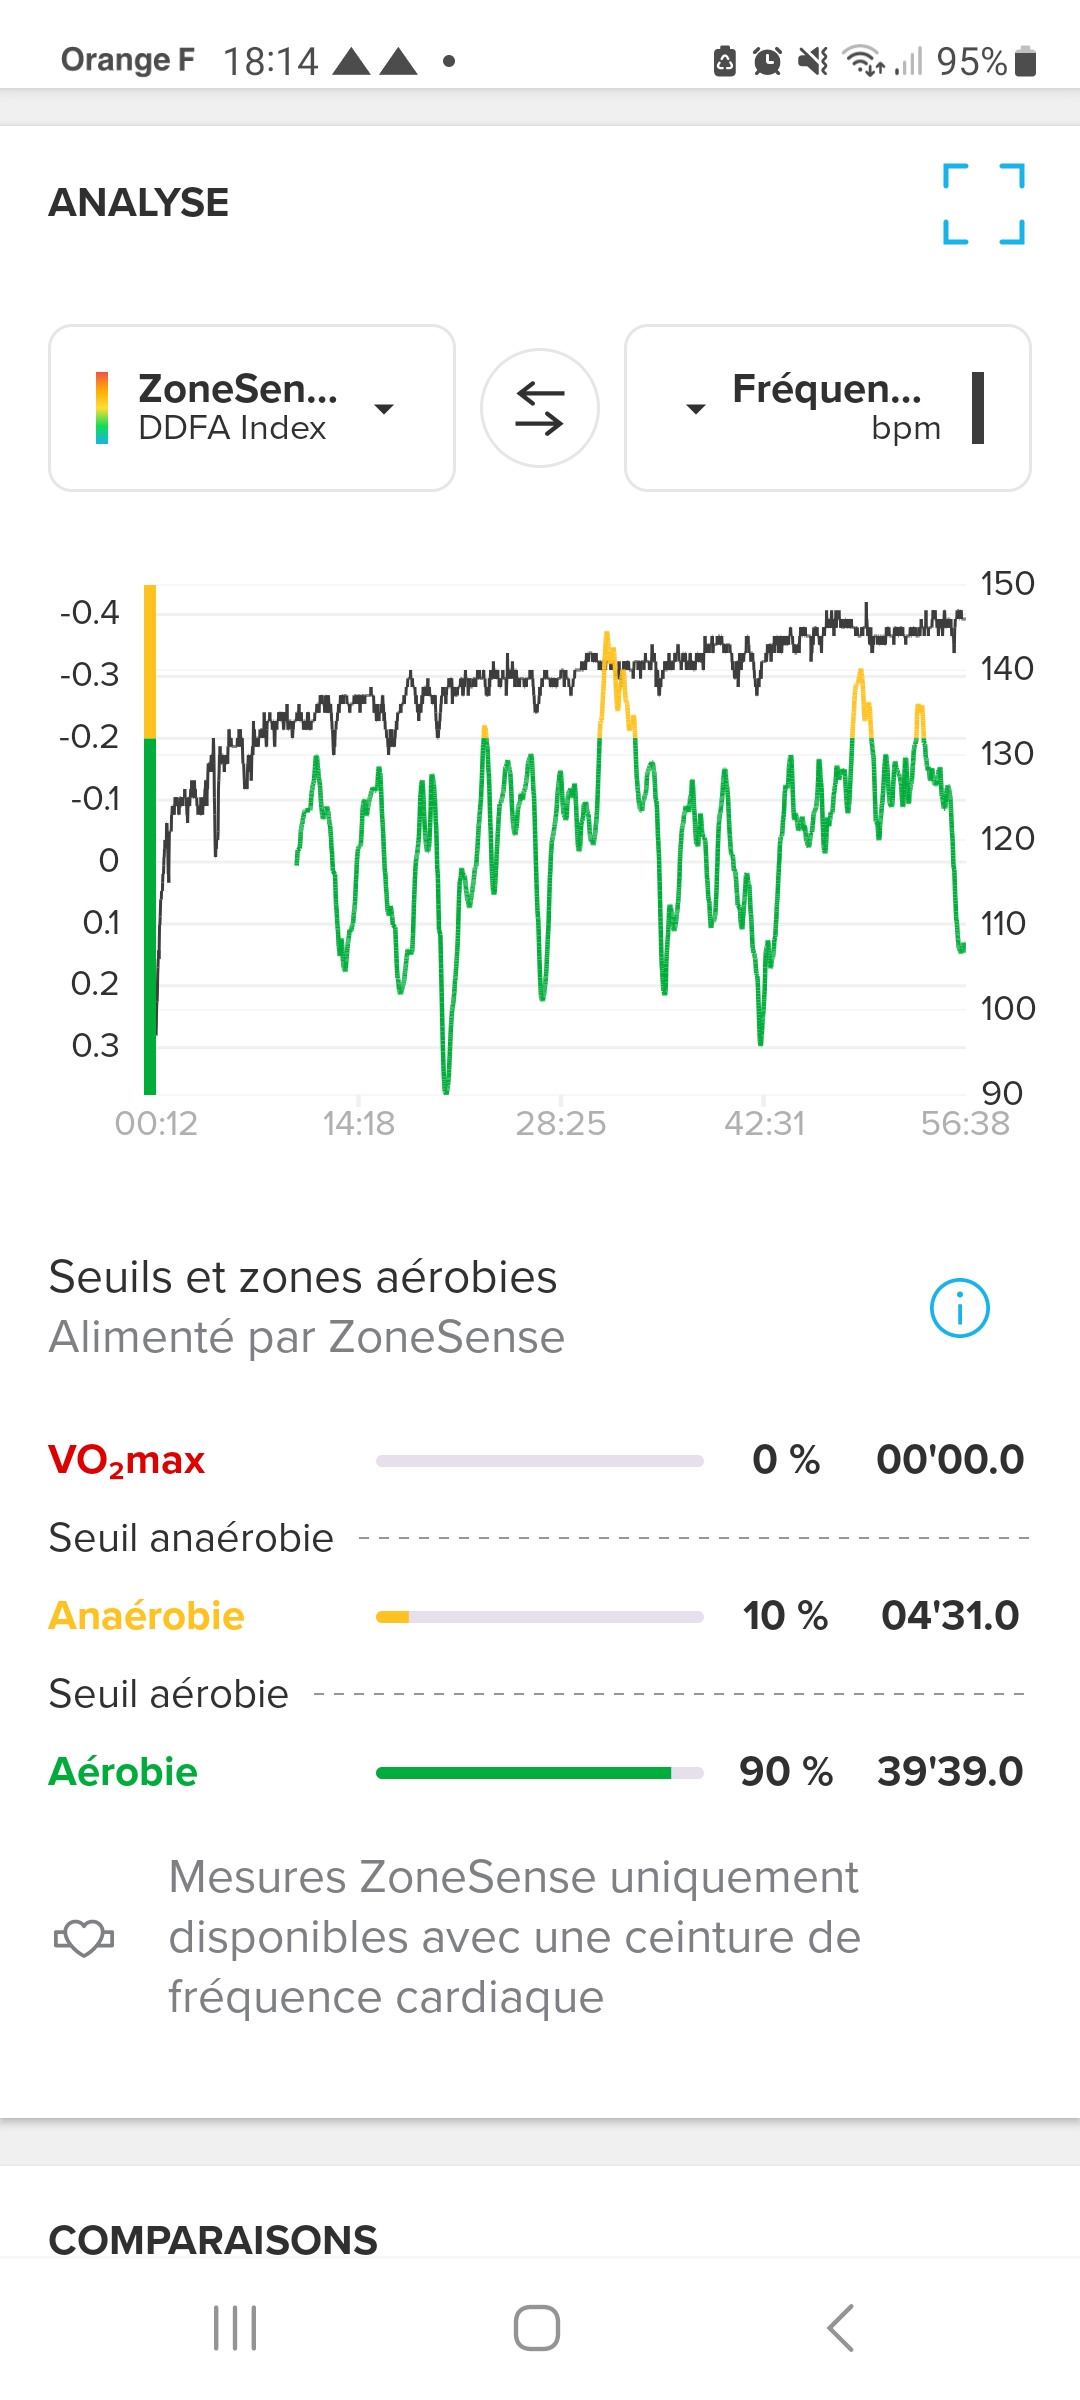
For the moment, I just did two run with zonesense, first was very relax, 17Km in 2 hours, second was much more intensive, 10Km in 56mn.
Definitely, I did not have similar sensations , 2nd was much more difficult, but zonesense reports almost the same result, aerobic in 97% for the first, and 89% for the 2nd, which I find hard to trust!You can try this to define HR zones:
https://moncoachdetriathlon.com/ressources-gratuites/calculateur-frequence-cardiaque/
Just put your email and you will be able dowload an Excel file and pdf file to compute your HR zones.
-
@luke55 said in Zonesense difficult to understand:
Your max HR is quite high, how did you determine it ?
For me, I used the formula 220 minus age, and increased it a bit, which gave me 158.
Zone values computed by the watch derived from this value, this why you find them so low.Given the sensations I have at 150 bpm, I can’t imagine trying to push higher, so a max HR of 158 seems reasonable for me.
For the moment, I just did two run with zonesense, first was very relax, 17Km in 2 hours, second was much more intensive, 10Km in 56mn.
Definitely, I did not have similar sensations , 2nd was much more difficult, but zonesense reports almost the same result, aerobic in 97% for the first, and 89% for the 2nd, which I find hard to trust!My max is set 3-5 bpm higher than the highest HR I had during the prior year. Since my late 30’s and early 40’s my Max has dropped from the low to mid 190’s. I do not know what your baseline fitness is. I have been training and racing ultras for the last 13 years.
-
Quite strange for me also:
According to publication on facebook:Suunto ZoneSense
🟢 Aerobic (green) – covering Z1–Z2
🟡 Anaerobic (yellow) – Z3–Z4
 VO2max (red) – everything beyond anaerobic threshold (Z5).
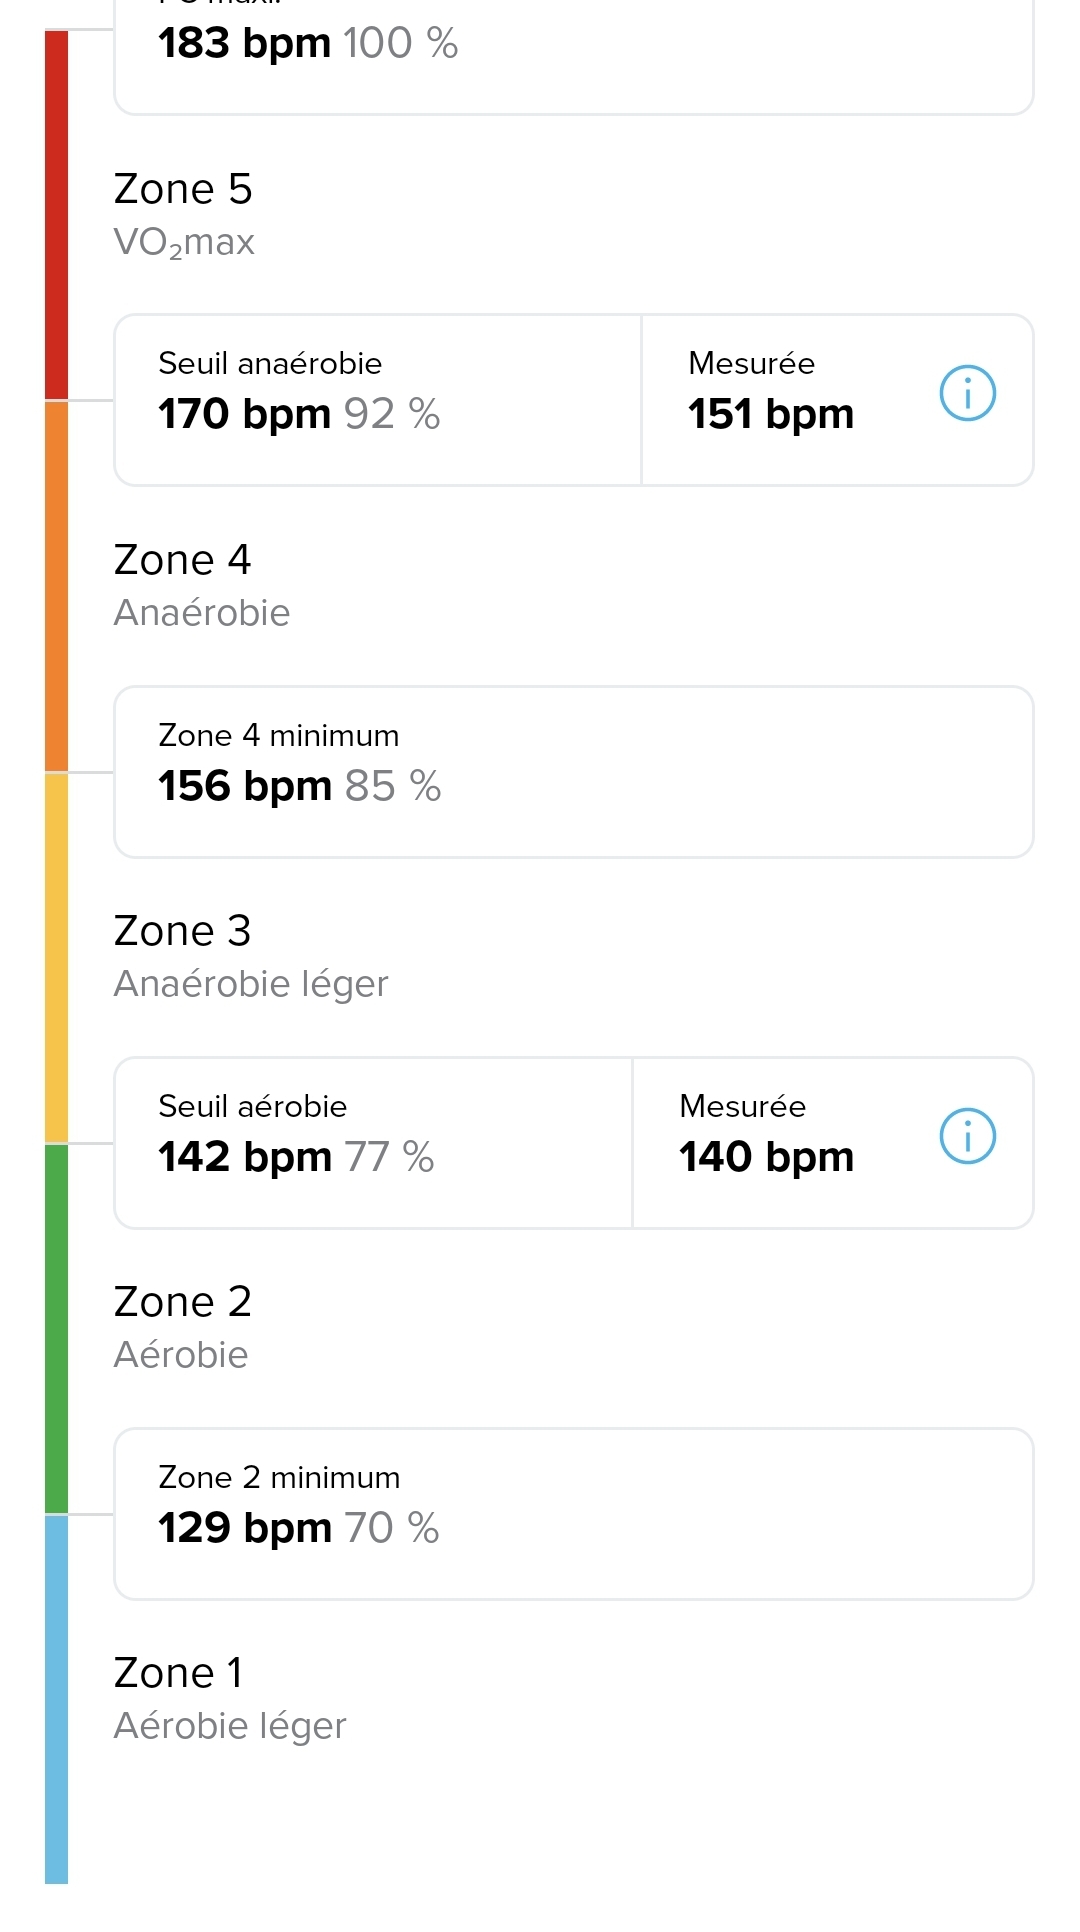
For me SuuntoSens mesured:
151bpm for VO2max (provided by suuntosens)
140bpm for z3-24 (anaerobic) (provided by suuntosens)But 170bpm during 13 minutes are considered in z3-z4 on SuuntoSens graph.
Over 140 is yellow : ok
But over 151 is not red: ko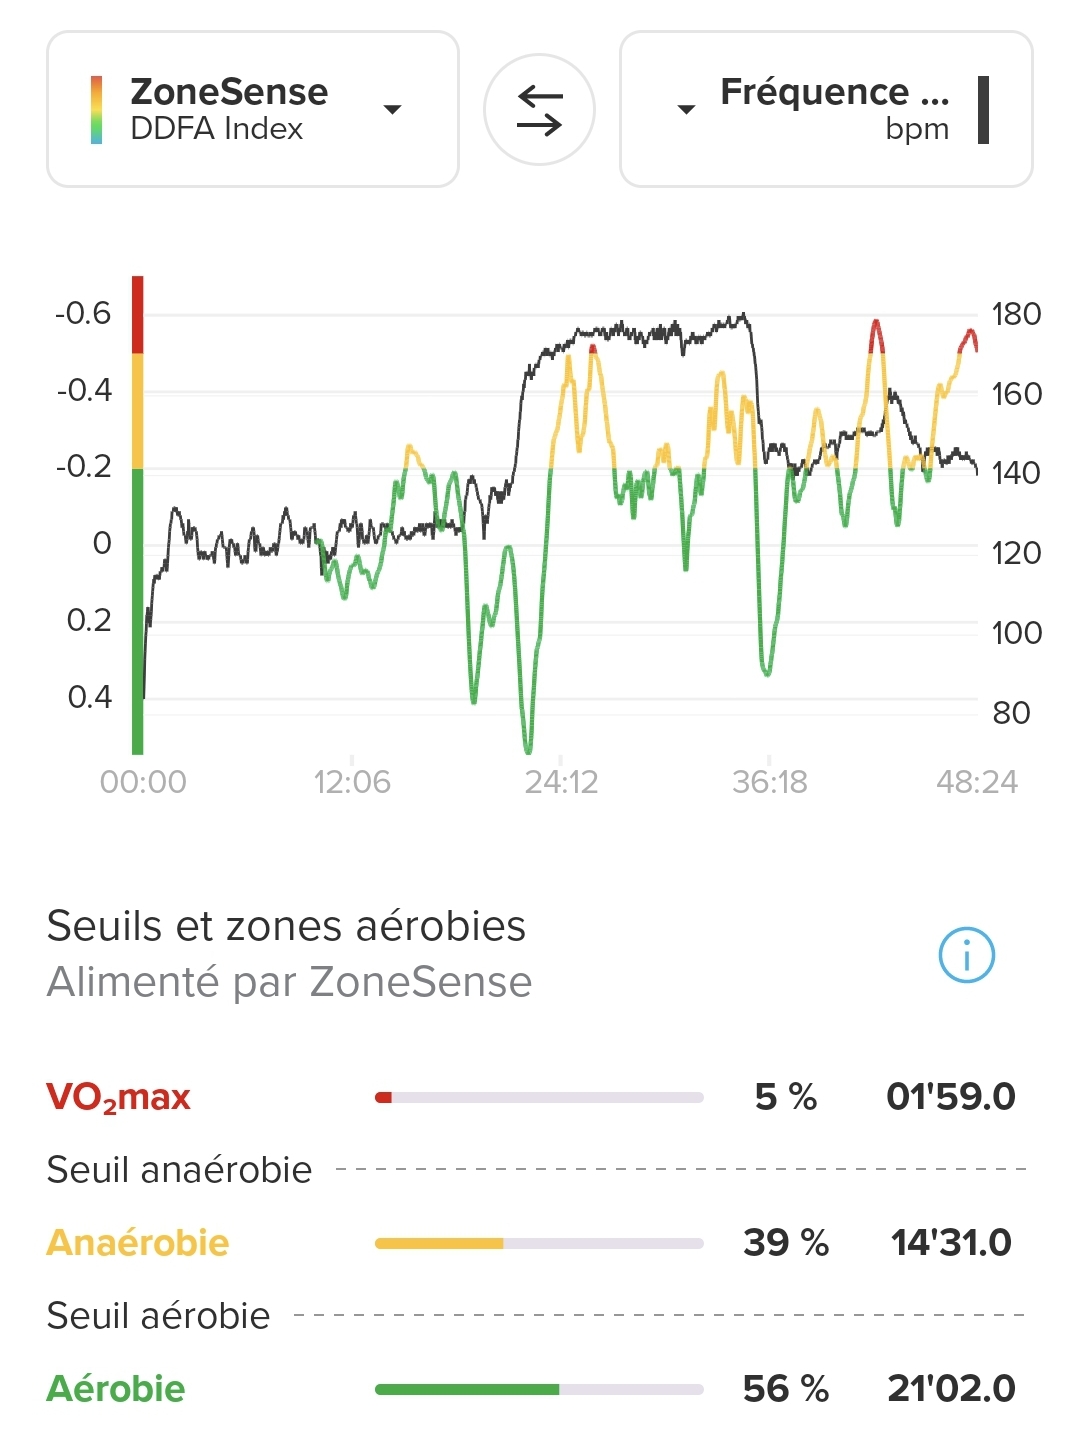
-
@Antoine Looks like Zonesense just takes the HR when entering a zone. In your case the two peaks were when your heartrate was rather low (so not really in sync).
If that really is the way it works, then its rather useless because it will be wrong due to lag or other effects.
For me Zonesense looks more like a Proove of Concept than an actual working feature…
Race S
Vertical Titanium Solar
Ambit3 Vertical -
As far I understand, zonesense is based on HR variability between beats and and this can only be measured with a chest HR sensor (it measures milliseconds differences between beats).
According to Suunto/MoniCardi this variability correlates with the lactate concentration in the blood, so the DDFA index is a indirect measure of lactate.If you look at the @Antoine graph above you can see that between 36’ and 48’ HR goes down but zonesense starts to show red peaks of VO2 max. This is because between 20’ and 36’ there was an intense activity and lactate started to accumulate rapidly.
Another example is in @Todd-Danielczyk graph, look at the end, HR goes down but zonesense shows that you are in VO2max, lactate is high and certainly Todd was exhausted at the end.
I have installed zonesense in my SR watch and I think this is a valuable tool but we need to get used to it.
-
@alebalbis Spot on assessment of how Zonesense can be used.
*also you are right, I was exhausted as I recovered from that one
-
@VoiGAS said in Zonesense difficult to understand:
@Antoine Looks like Zonesense just takes the HR when entering a zone. In your case the two peaks were when your heartrate was rather low (so not really in sync).
If that really is the way it works, then its rather useless because it will be wrong due to lag or other effects.
For me Zonesense looks more like a Proove of Concept than an actual working feature…That is not how ZoneSense works. Have you watched the video? Have you read the peer-reviewed manuscripts published in scientific journals? Have you read the white paper? Please stop speculating on what you think is happening. Perhaps educate yourself instead of making statements that are completely incorrect. I have replied to you many times stating this is not a measure of HR, so have others. It is not meant to follow HR nor is the measurement based on HR. It is based on relationships between IBI and in this manuscript, has been tested far more scientifically than anyone on this forum including me is likely to do. You refuse to acknowledge this. I am fine with you being skeptical of using it but understand how the feature works prior to continuing to assume it is synced to HR!
Kanniainen et al. - 2023 - Estimation of physiological exercise thresholds based on dynamical correlation properties of heart r.pdf -
Hi, I started using the ZS some months ago and I quite intrigued by this new kind of analysis of the HR data. However, I find difficult to understand the results I get. The following graphs refer to the cardio activities I usually performed at the gym: I wear the Suunto smart HR belt at home and walked to the gym and back, so the “real” activity is the central part where the HR goes up. I wonder why in my case the ZS seems to be nearly anticorrelated to the HR data, going usually down during the more intense part of the recorded activity. Maybe the initial part il too long or too easy to correctly trigger the ZS detection? Any hint?
At least, over 16 similar activities, I got 3 times consistent determinations of the Aerobic Threshold (133, 136 and 137 bpm)
Suunto Vector . Vector HR . Core . Race & Race S
-
@Brad_Olwin
How did you determine your max HR, it seems quite high at 67 !!
For me, I just applied the formula 220 minus age, and increased a bit the result, and all zone values computed by the watch are based on that, this is why they seem so low. -
@luke55 sorry, wrong post, cant delete
-
@luke55 said in Zonesense difficult to understand:
@Brad_Olwin
How did you determine your max HR, it seems quite high at 67 !!
For me, I just applied the formula 220 minus age, and increased a bit the result, and all zone values computed by the watch are based on that, this is why they seem so low.I add a few bpm to my max for the last few months. Last set of uphill intervals I did the max was 178 bpm three days ago. Been routinely hitting 177 on these so 180-183 is probably about right. That is how I determine my max.
BTW I am 68 now.
Using age calculations is a bad idea IMHO, they are usually way, way off.
-
Out of coincidence, does Zonesense only work for long, steady efforts? I do a lot of HIIT and Hyrox training, and I find that my feelings and regular BPM correlate, but Zonesense will show me as working mainly aerobically.
Equipment: Suunto Race Titanium
SA: Android (Beta) -
@Steven-Limmer said in Zonesense difficult to understand:
but Zonesense will show me as working mainly aerobically.
that happens to me too (see my previous post)
-
@Steven-Limmer said in Zonesense difficult to understand:
Out of coincidence, does Zonesense only work for long, steady efforts?
Yes. ZoneSense needs about 2 minutes to catch up with reality.
-
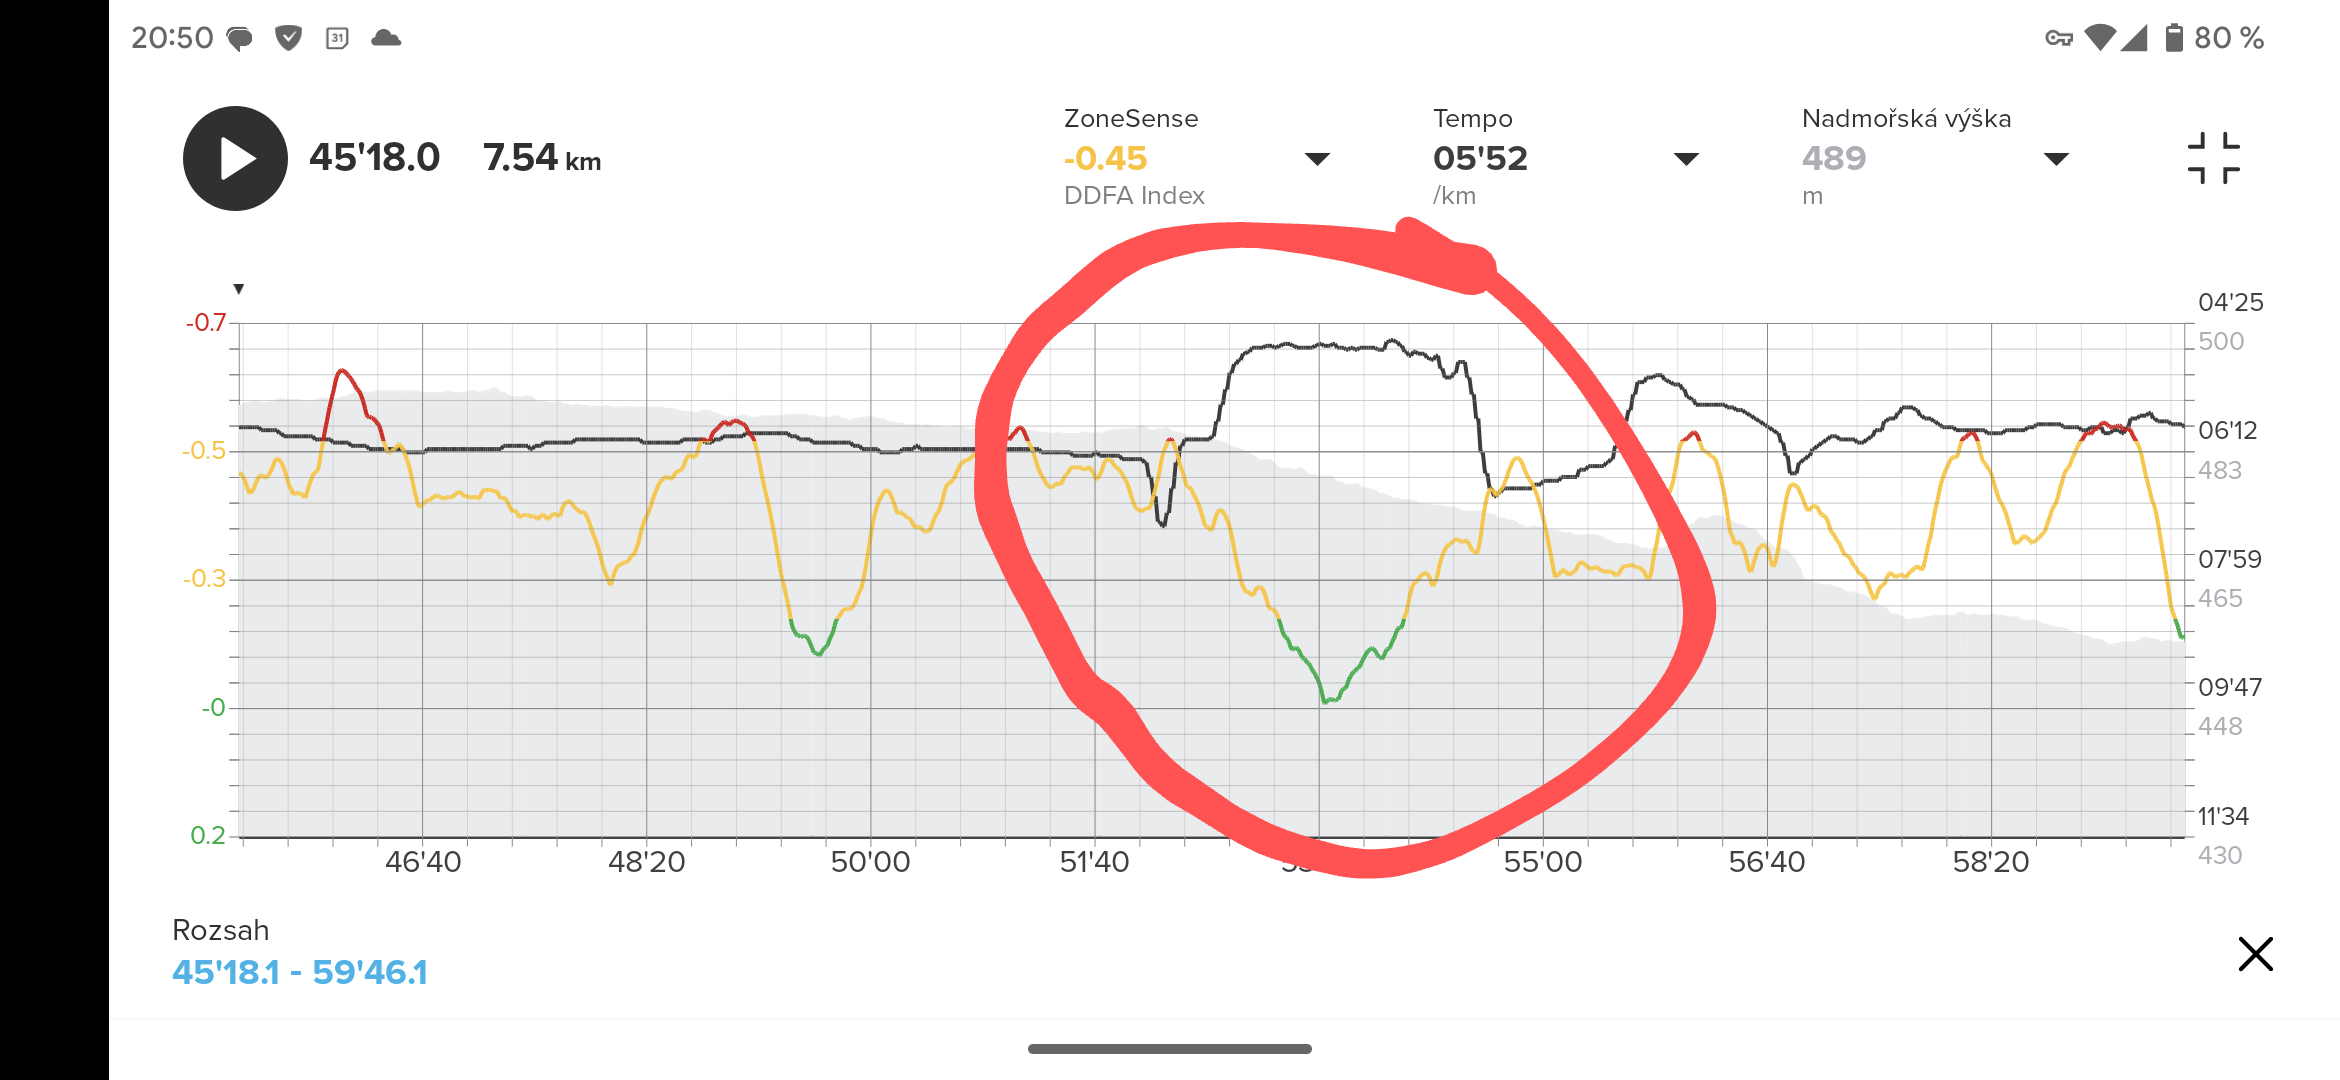
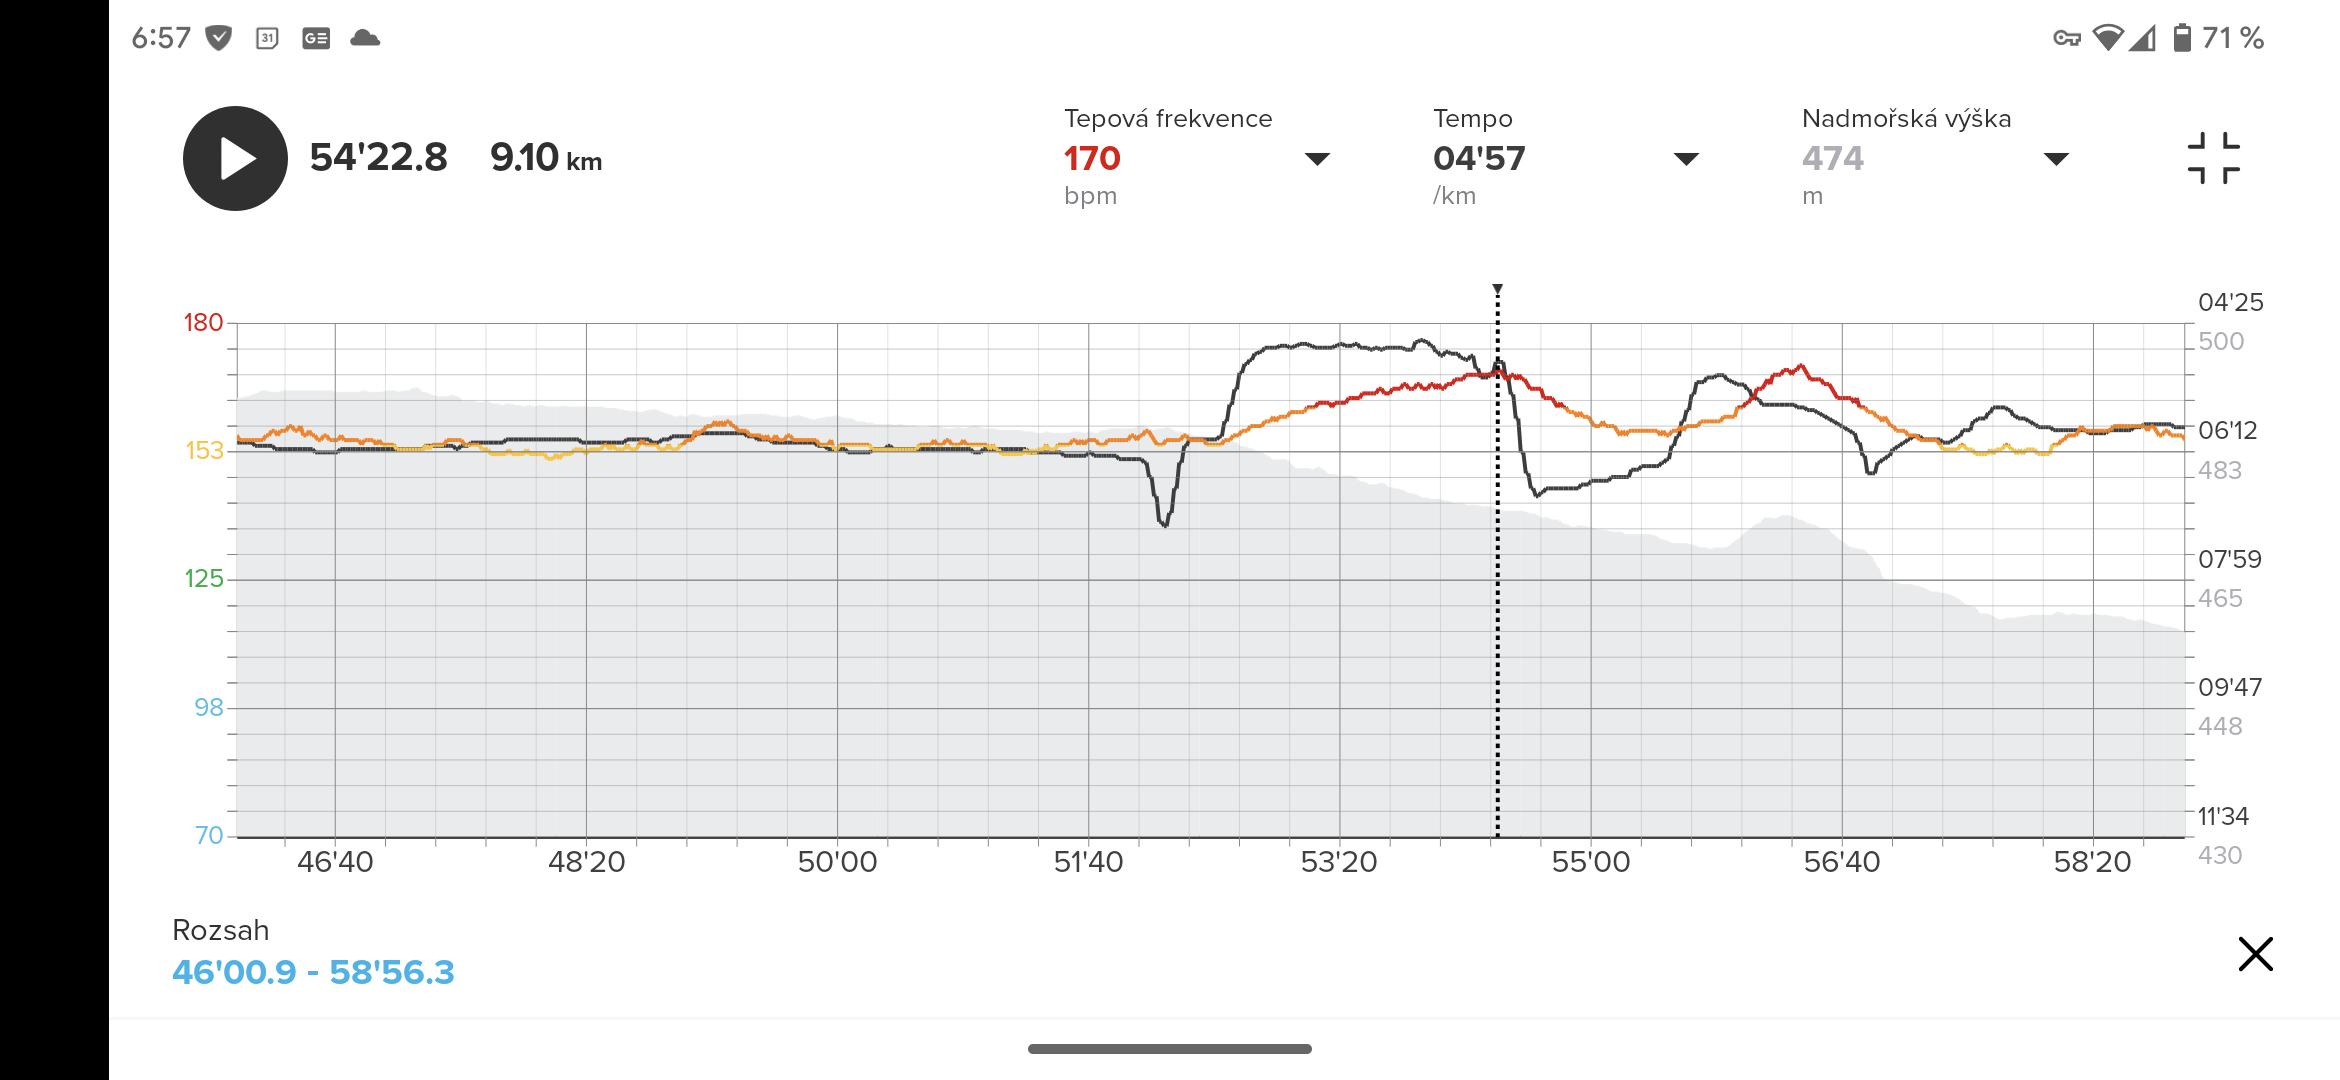
@Stefano-M64 I have a similar experience. Big acceleration in the last kilometer and a drop in Zone sense.
-
@Jan-Suchánek You are going downhill! I bet HR drops or does not change, this seems fine to me. This is a very short segment maybe a bit over 2 min or 3? Not what ZS is designed for. You can find a lot of information about ZS in the videos on this thread.
Vector/T6c/Vertical 2 Ti
-
@Brad_Olwin No, you’re wrong. This part was 400m long with 10m descent. Almost flat. My pace raised from 6:10 to 4:50 and my HR raised from 153 to 170 at the end of interval.
Suunto Vertical 2
-
@Brad_Olwin Sorry for a bit off-topic but since you have so much experience with Suunto watches and the app, do you have any idea why my pace curves in the SA are so coarse? In the below screenshot I’ve set it up exactly like Jan’s shot (and this is on Android - which I think his is as well) with a 15 minutes window.
Granted that his pace scale is about twice my own, but that shouldn’t make such a difference. My pace data looks like it only have sporadic data points, but I’ve examined the .fit files and the ‘speed’ entries are logged every second and have normal variations.
I’ve never seen a finely plotted pace curve since I bought the Race S in Dec 2024.
Edit: The pace information while running, on the watch, is without any surprises and shows normal second variations. It’s just the graphs afterwards that lack definition, and frankly make them impossible to use for any insight as to what I actually did speed-wise:
Suunto Race S
-
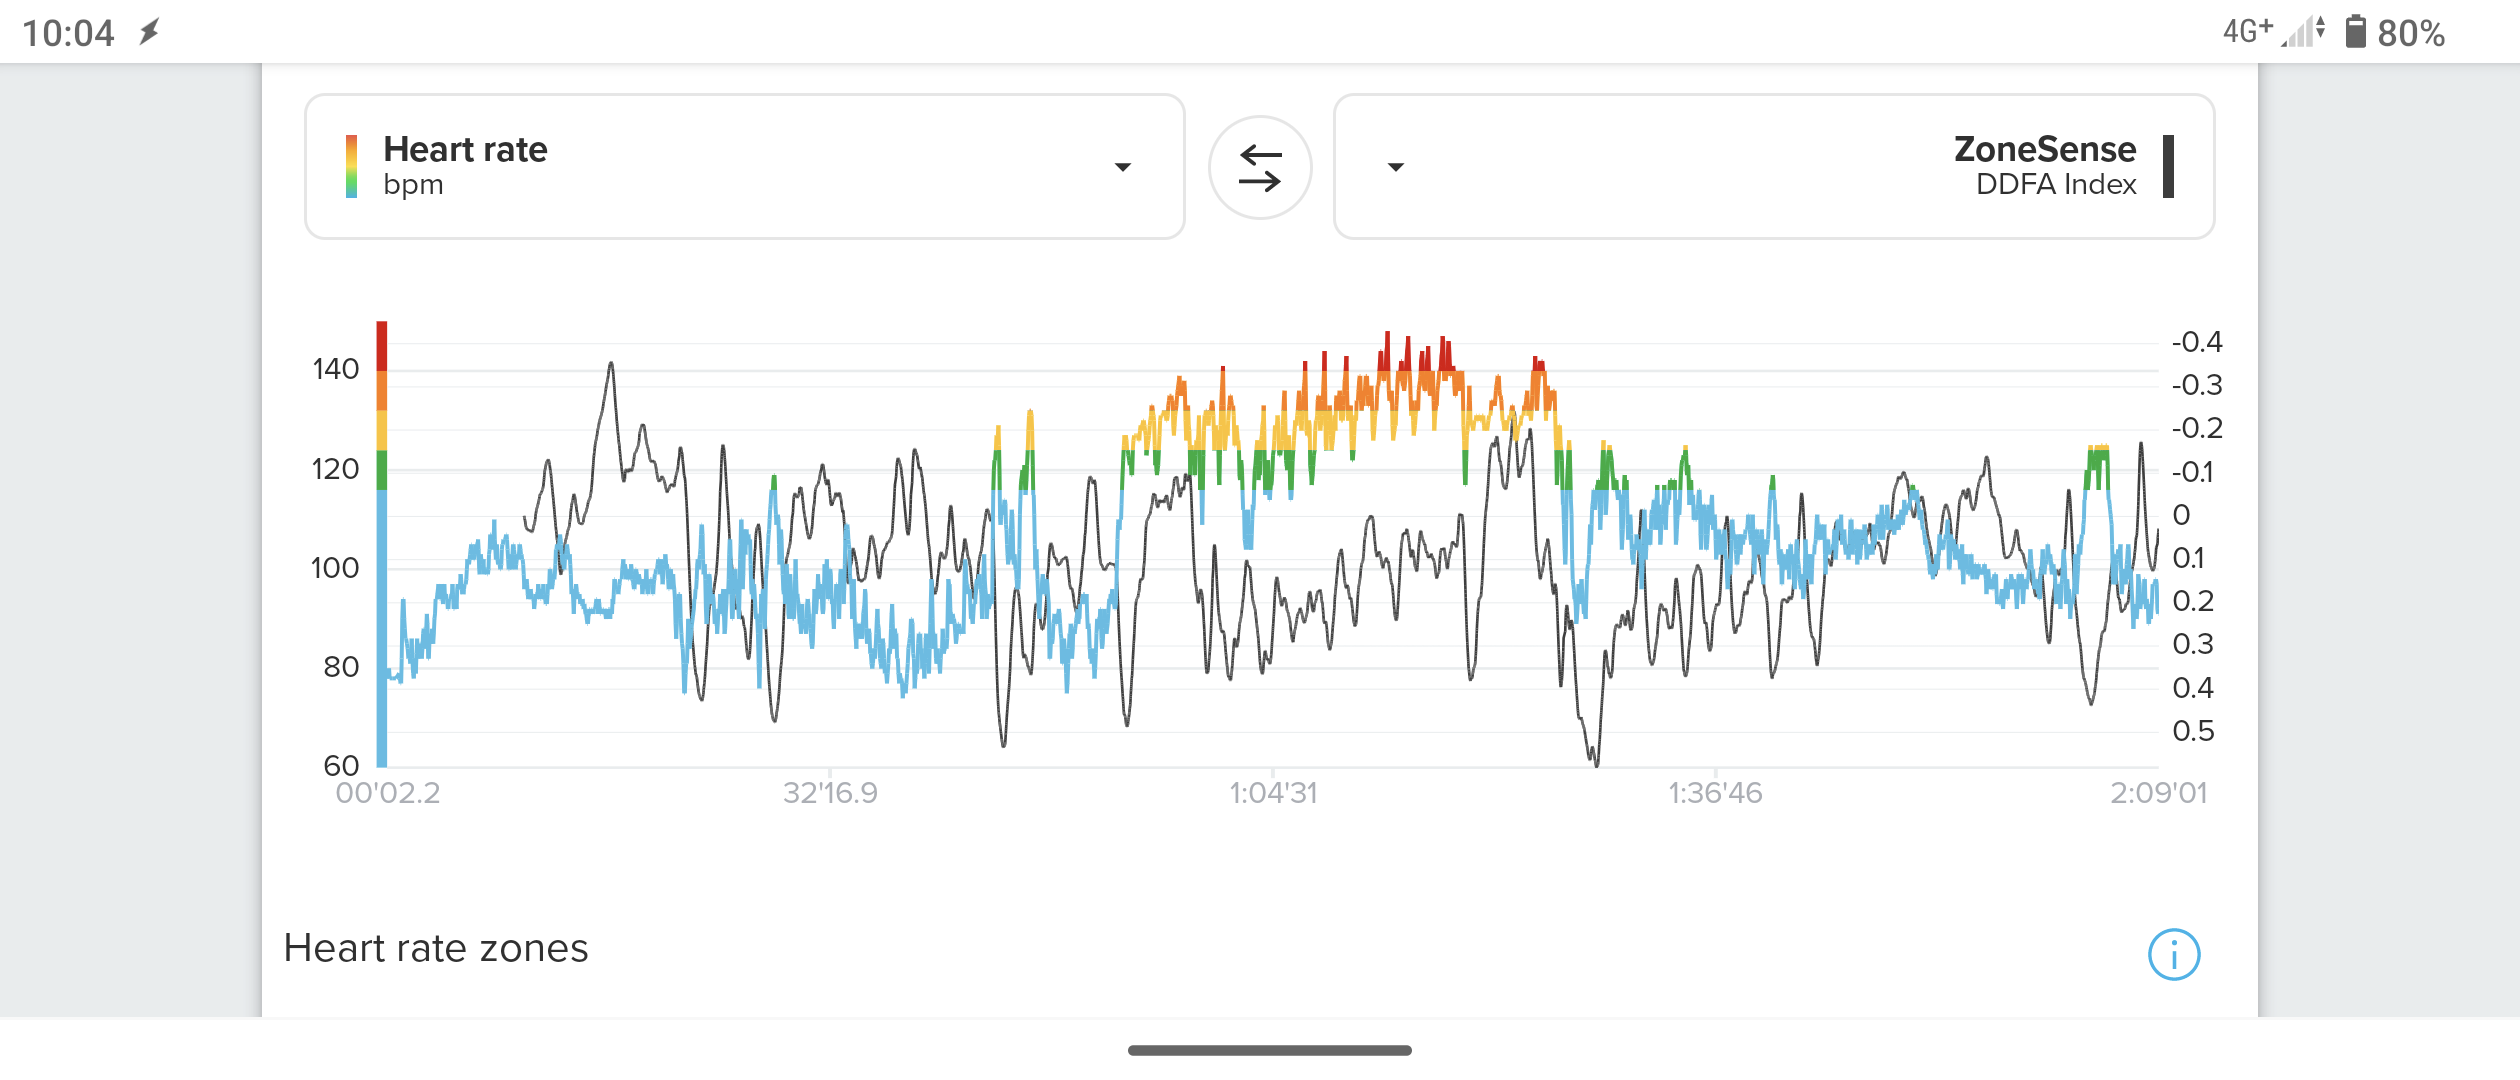
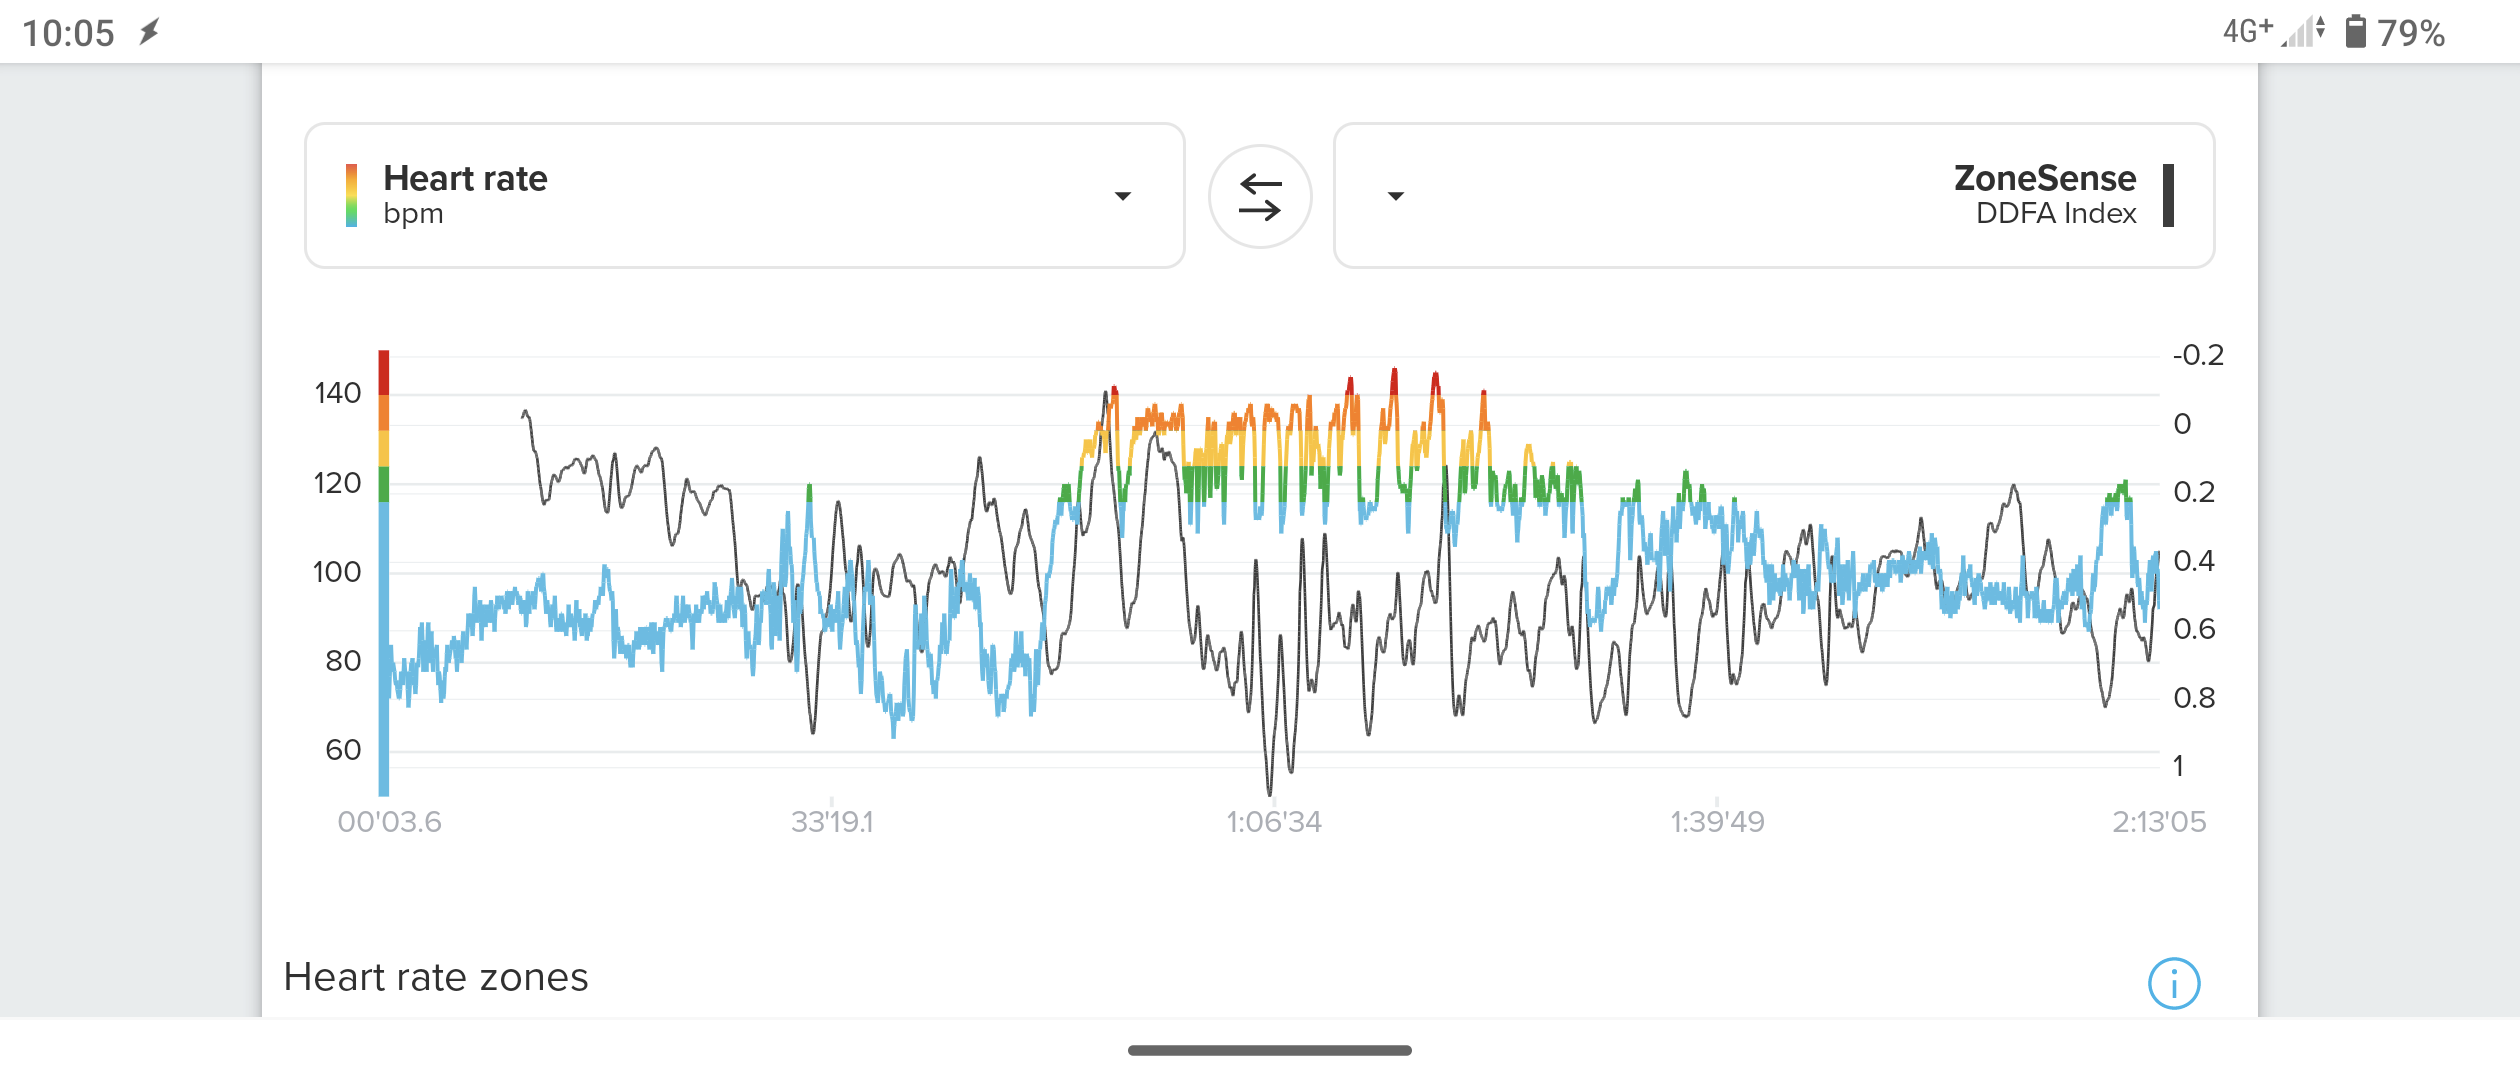
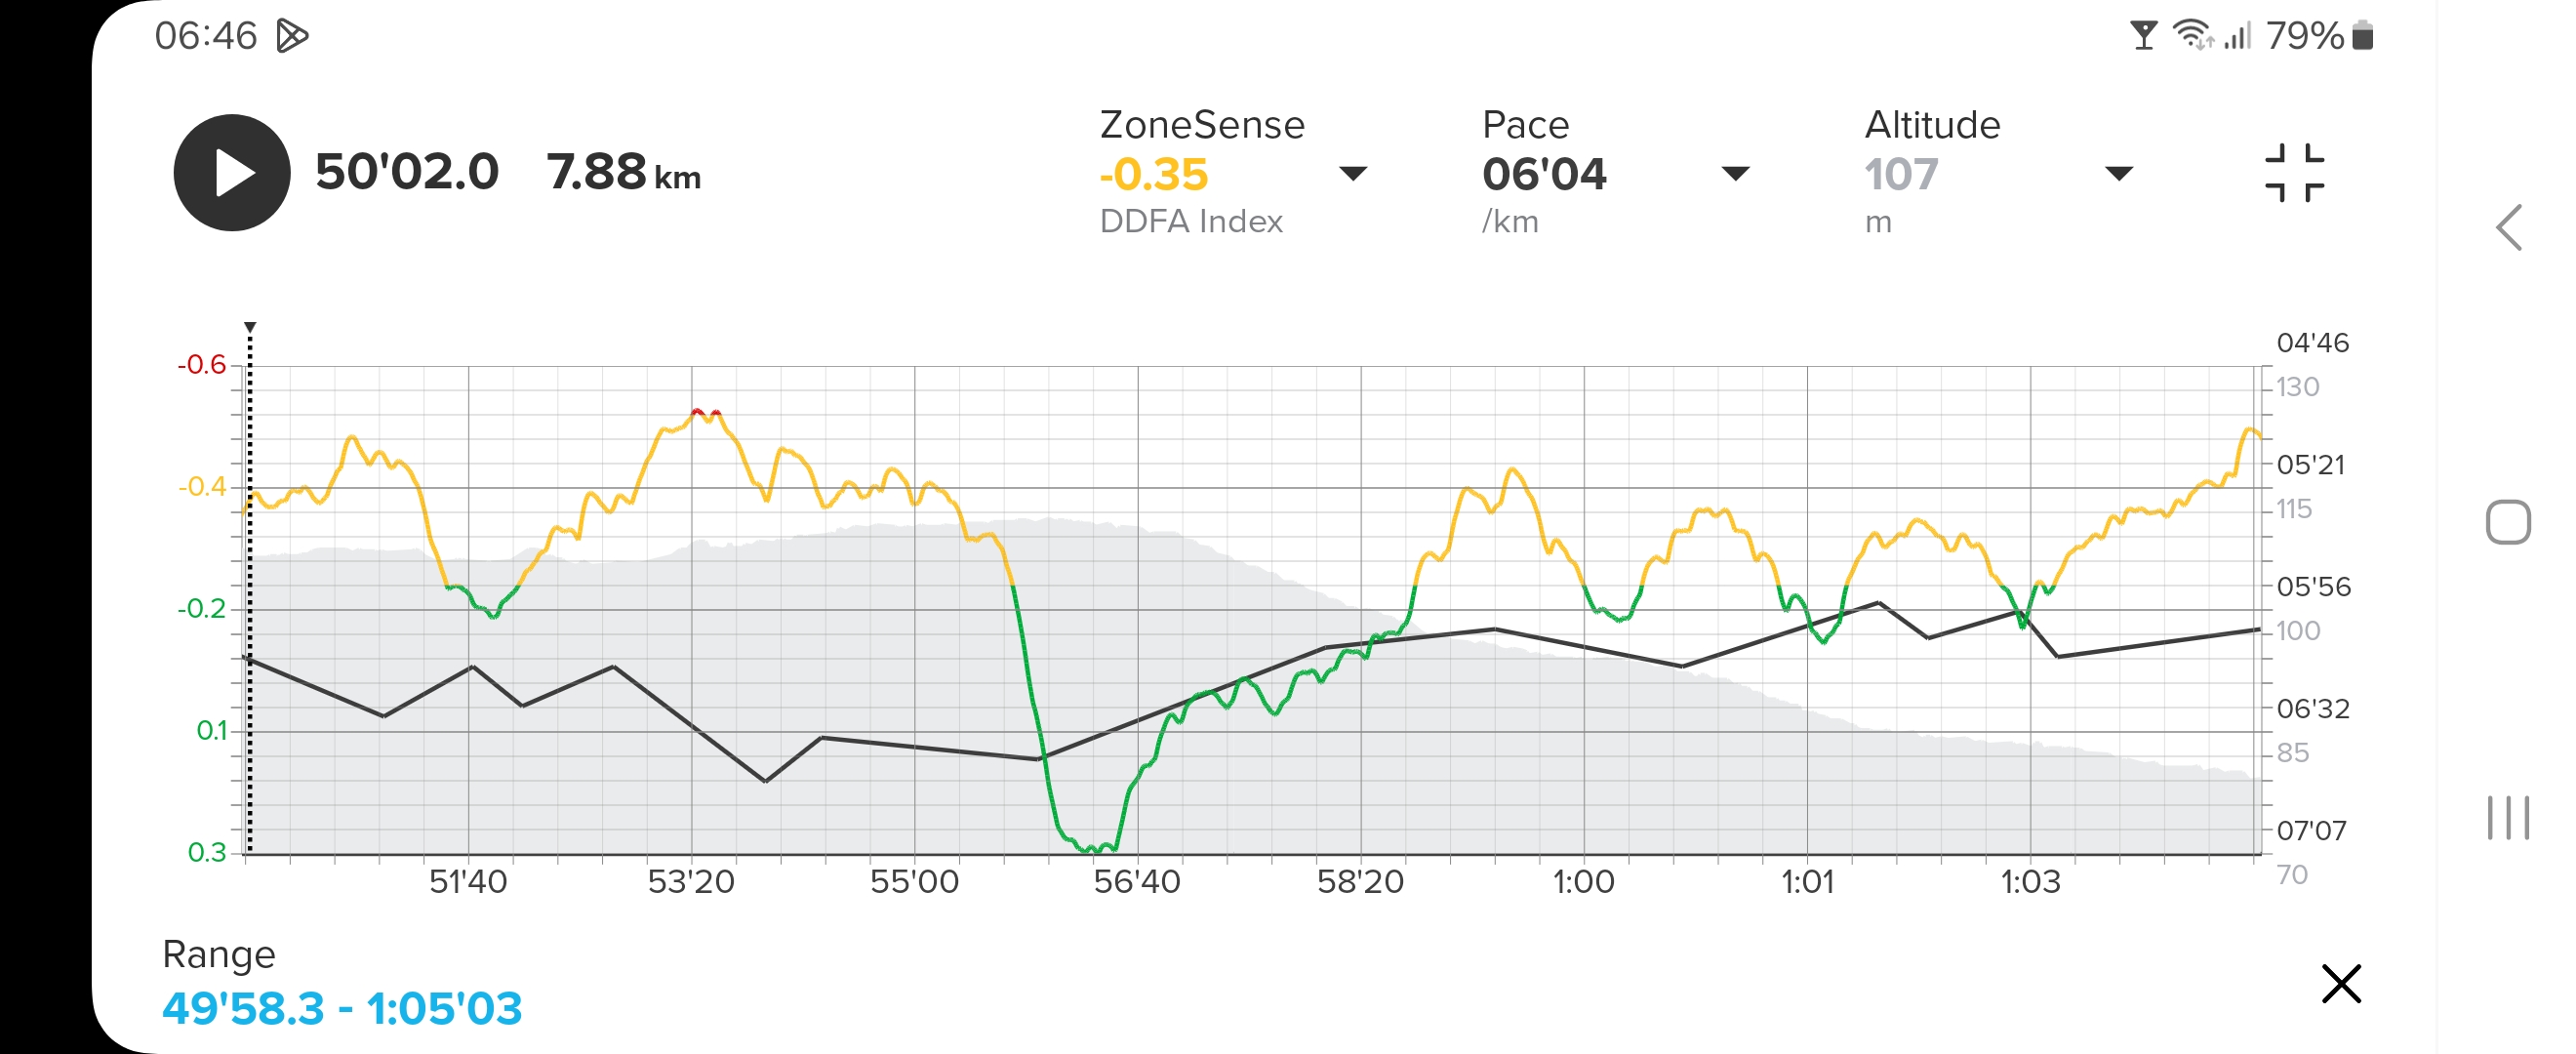
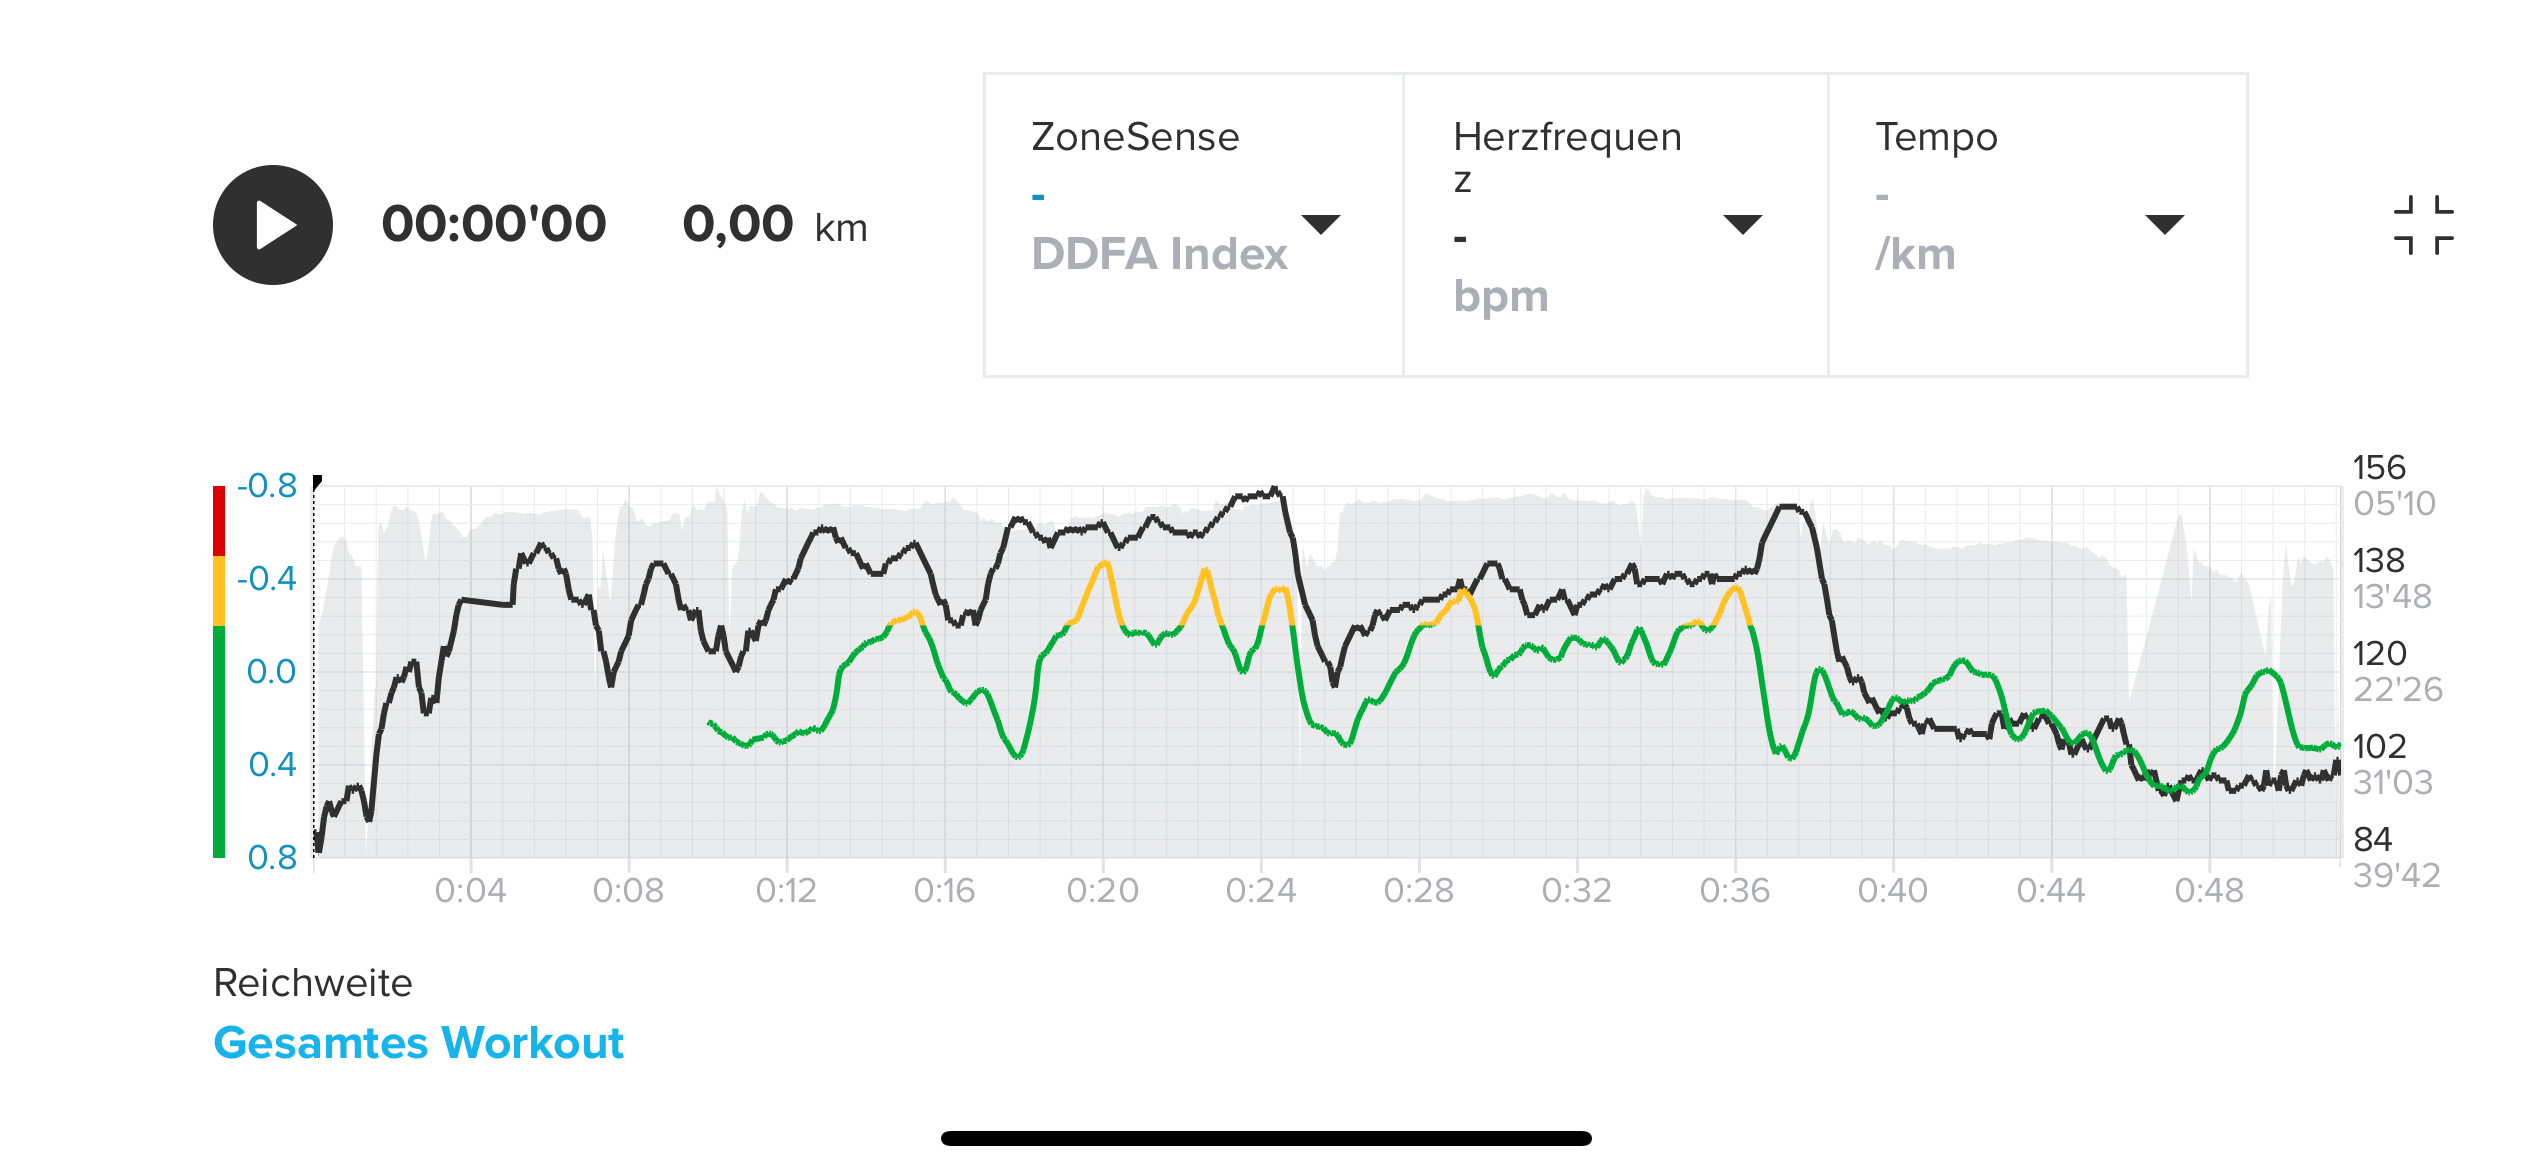
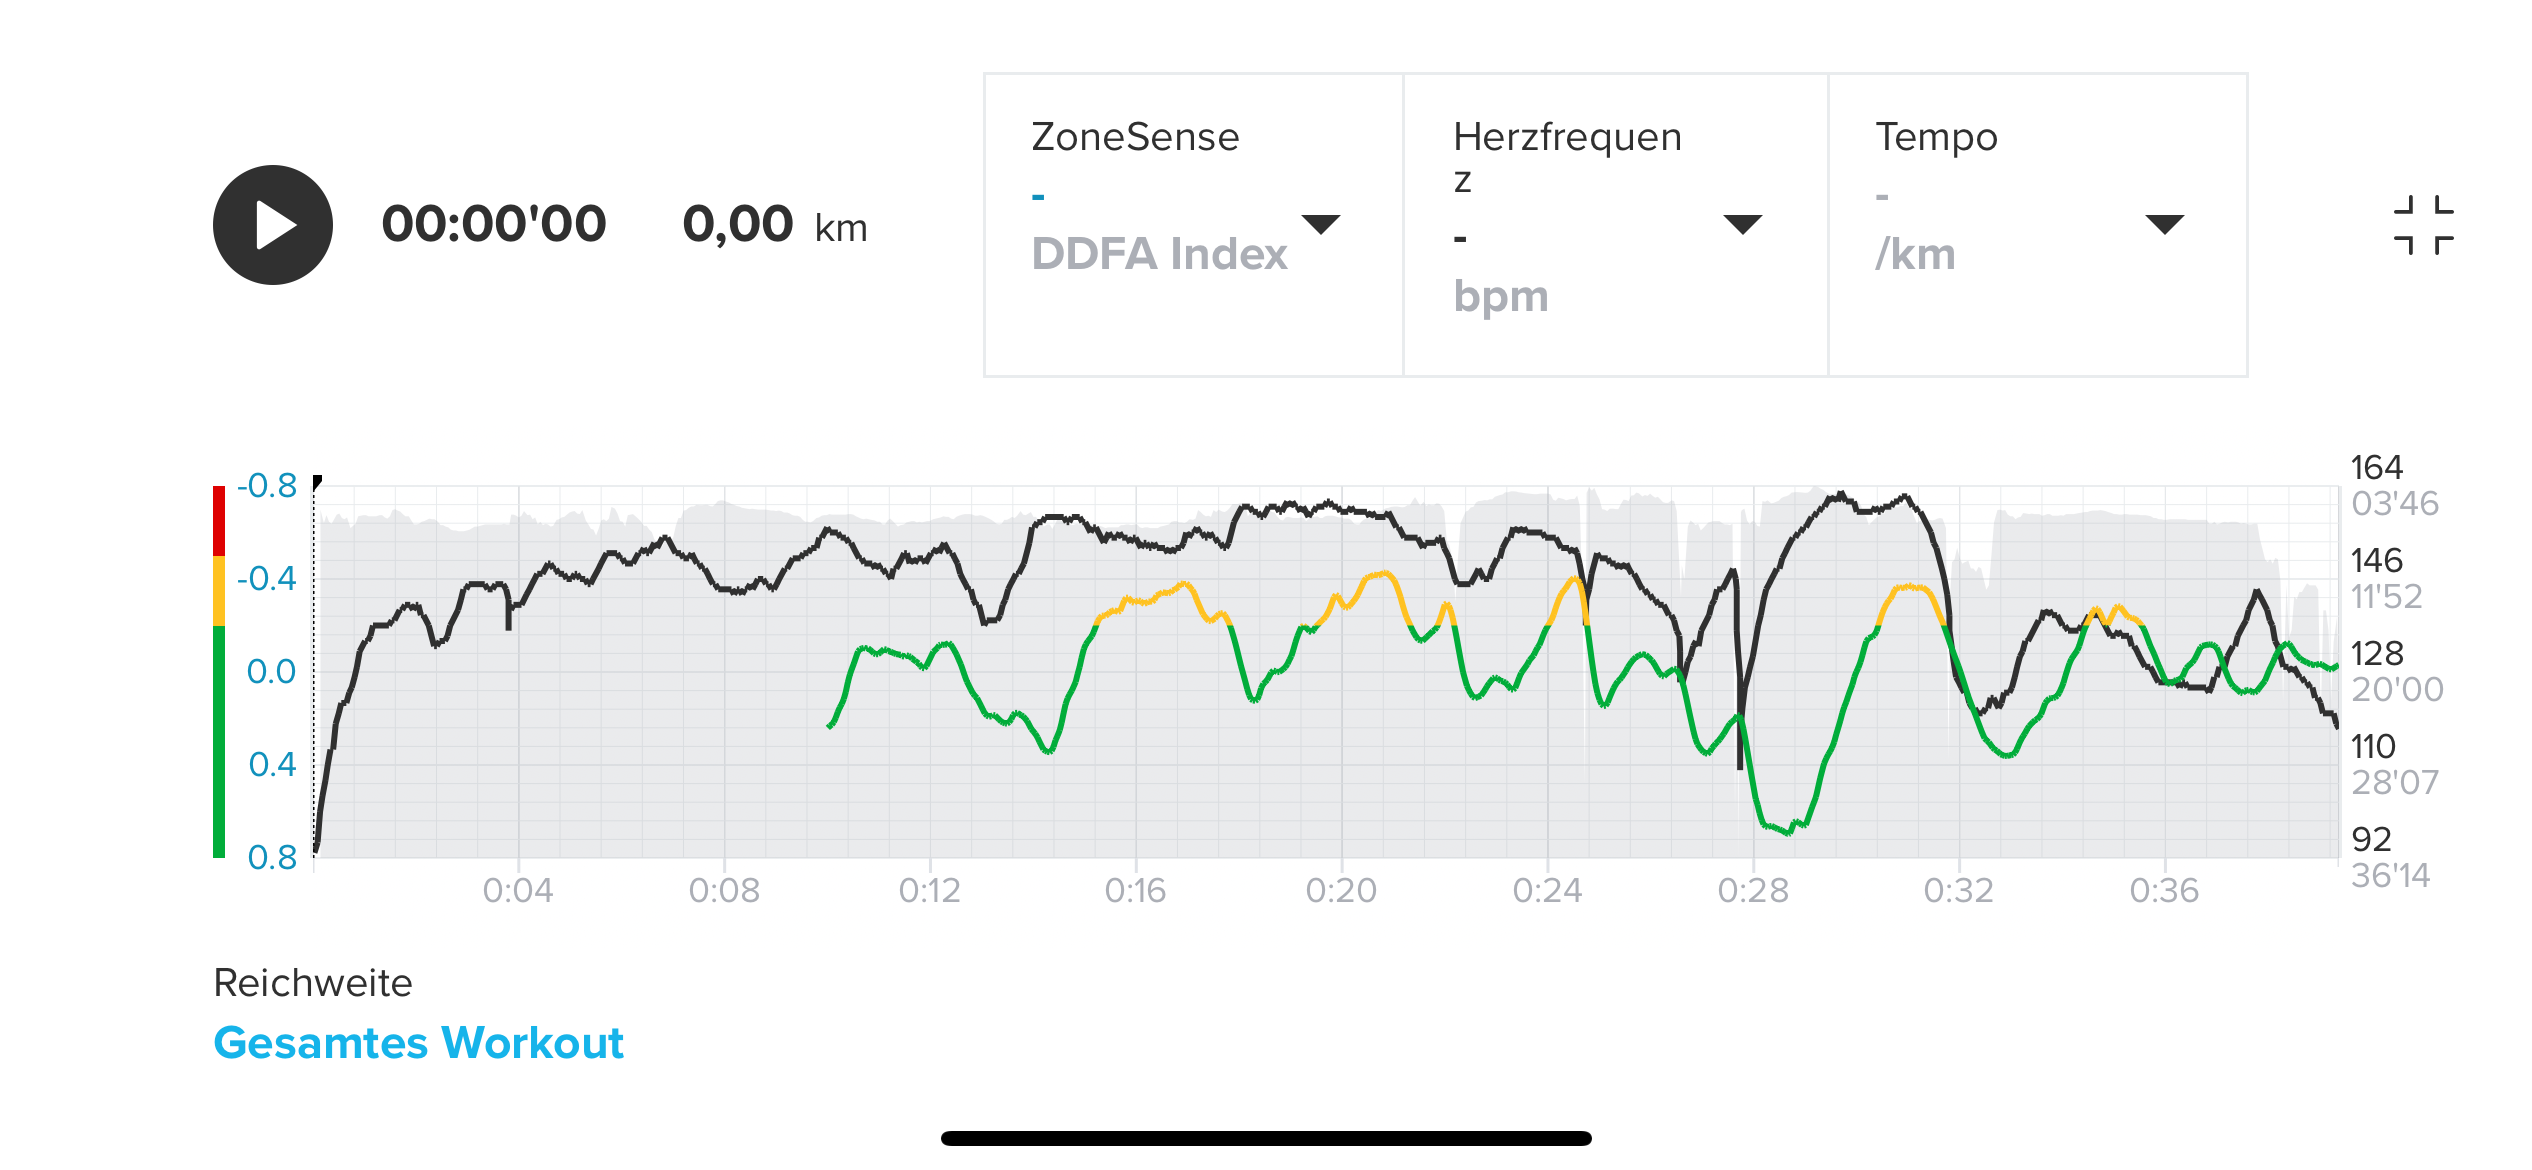
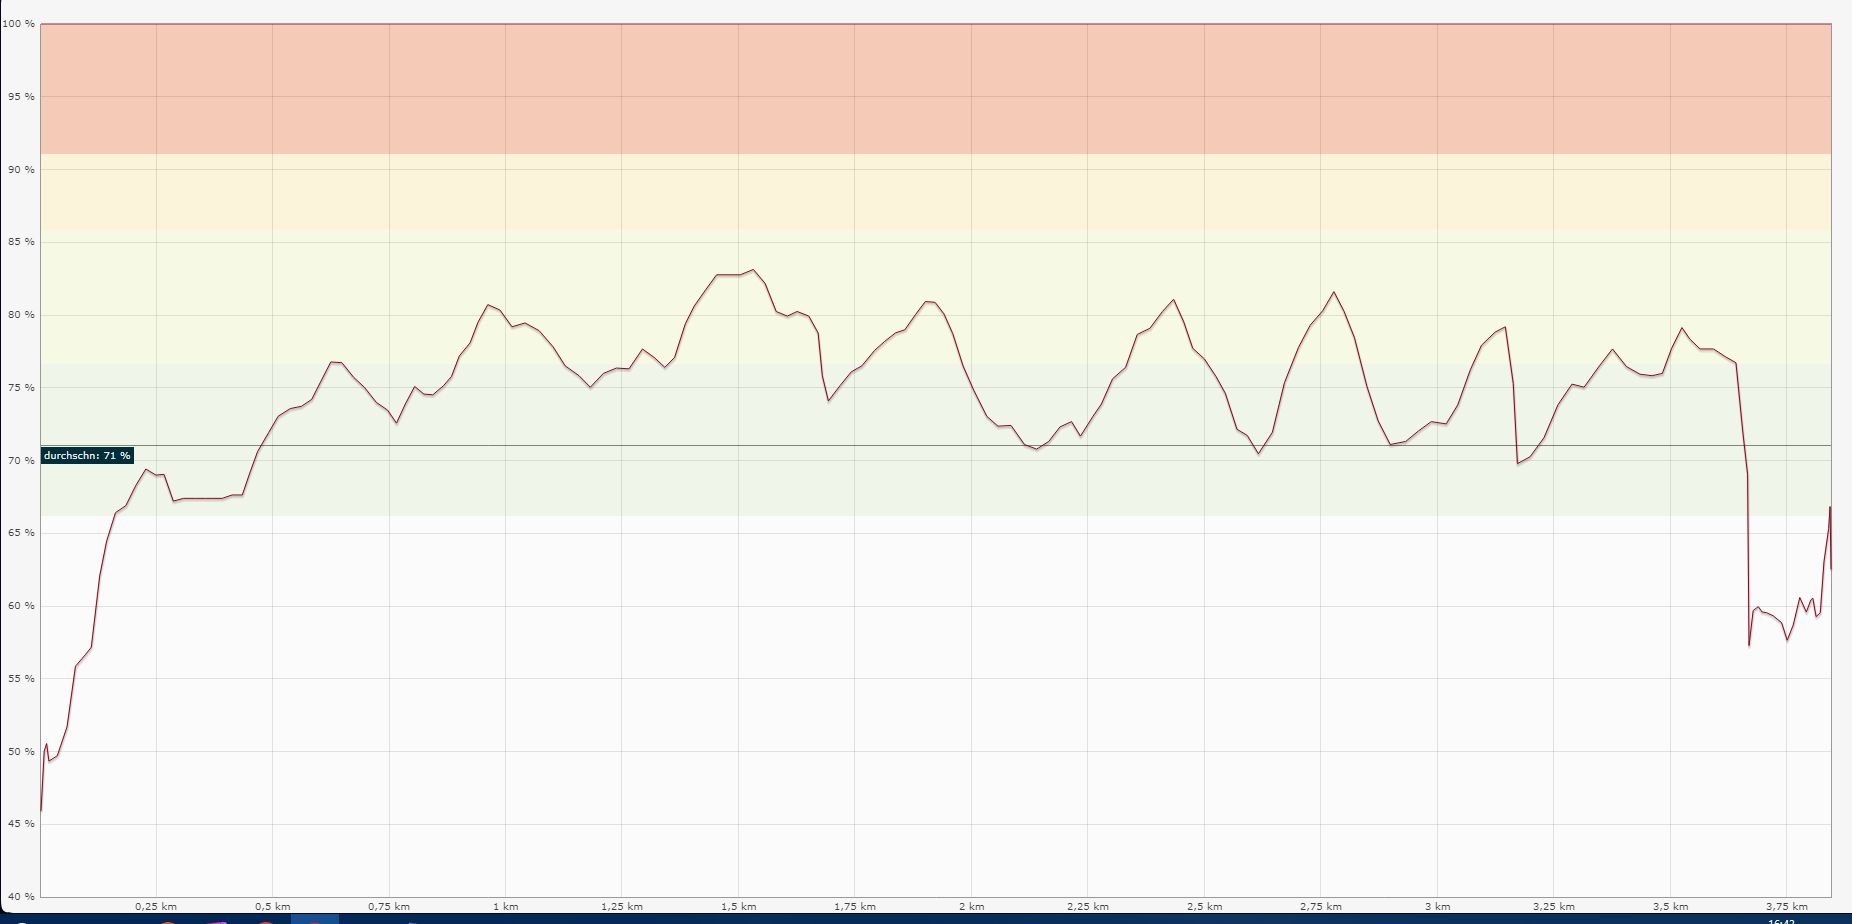
Those are results from some runs lately. Im not fit in the moment cause off a herniated disc. So no v2Omax at the moment. At the first picture it looks like zone sense has a negativ correlation to the HR but if you look at the other ones it looks more like the Zone Sense diagram is shifted to the left or to the right on the last picture.
Haven’t done a run after the latest update I think.
But maybe some with more insider oder sientific background can clarify this.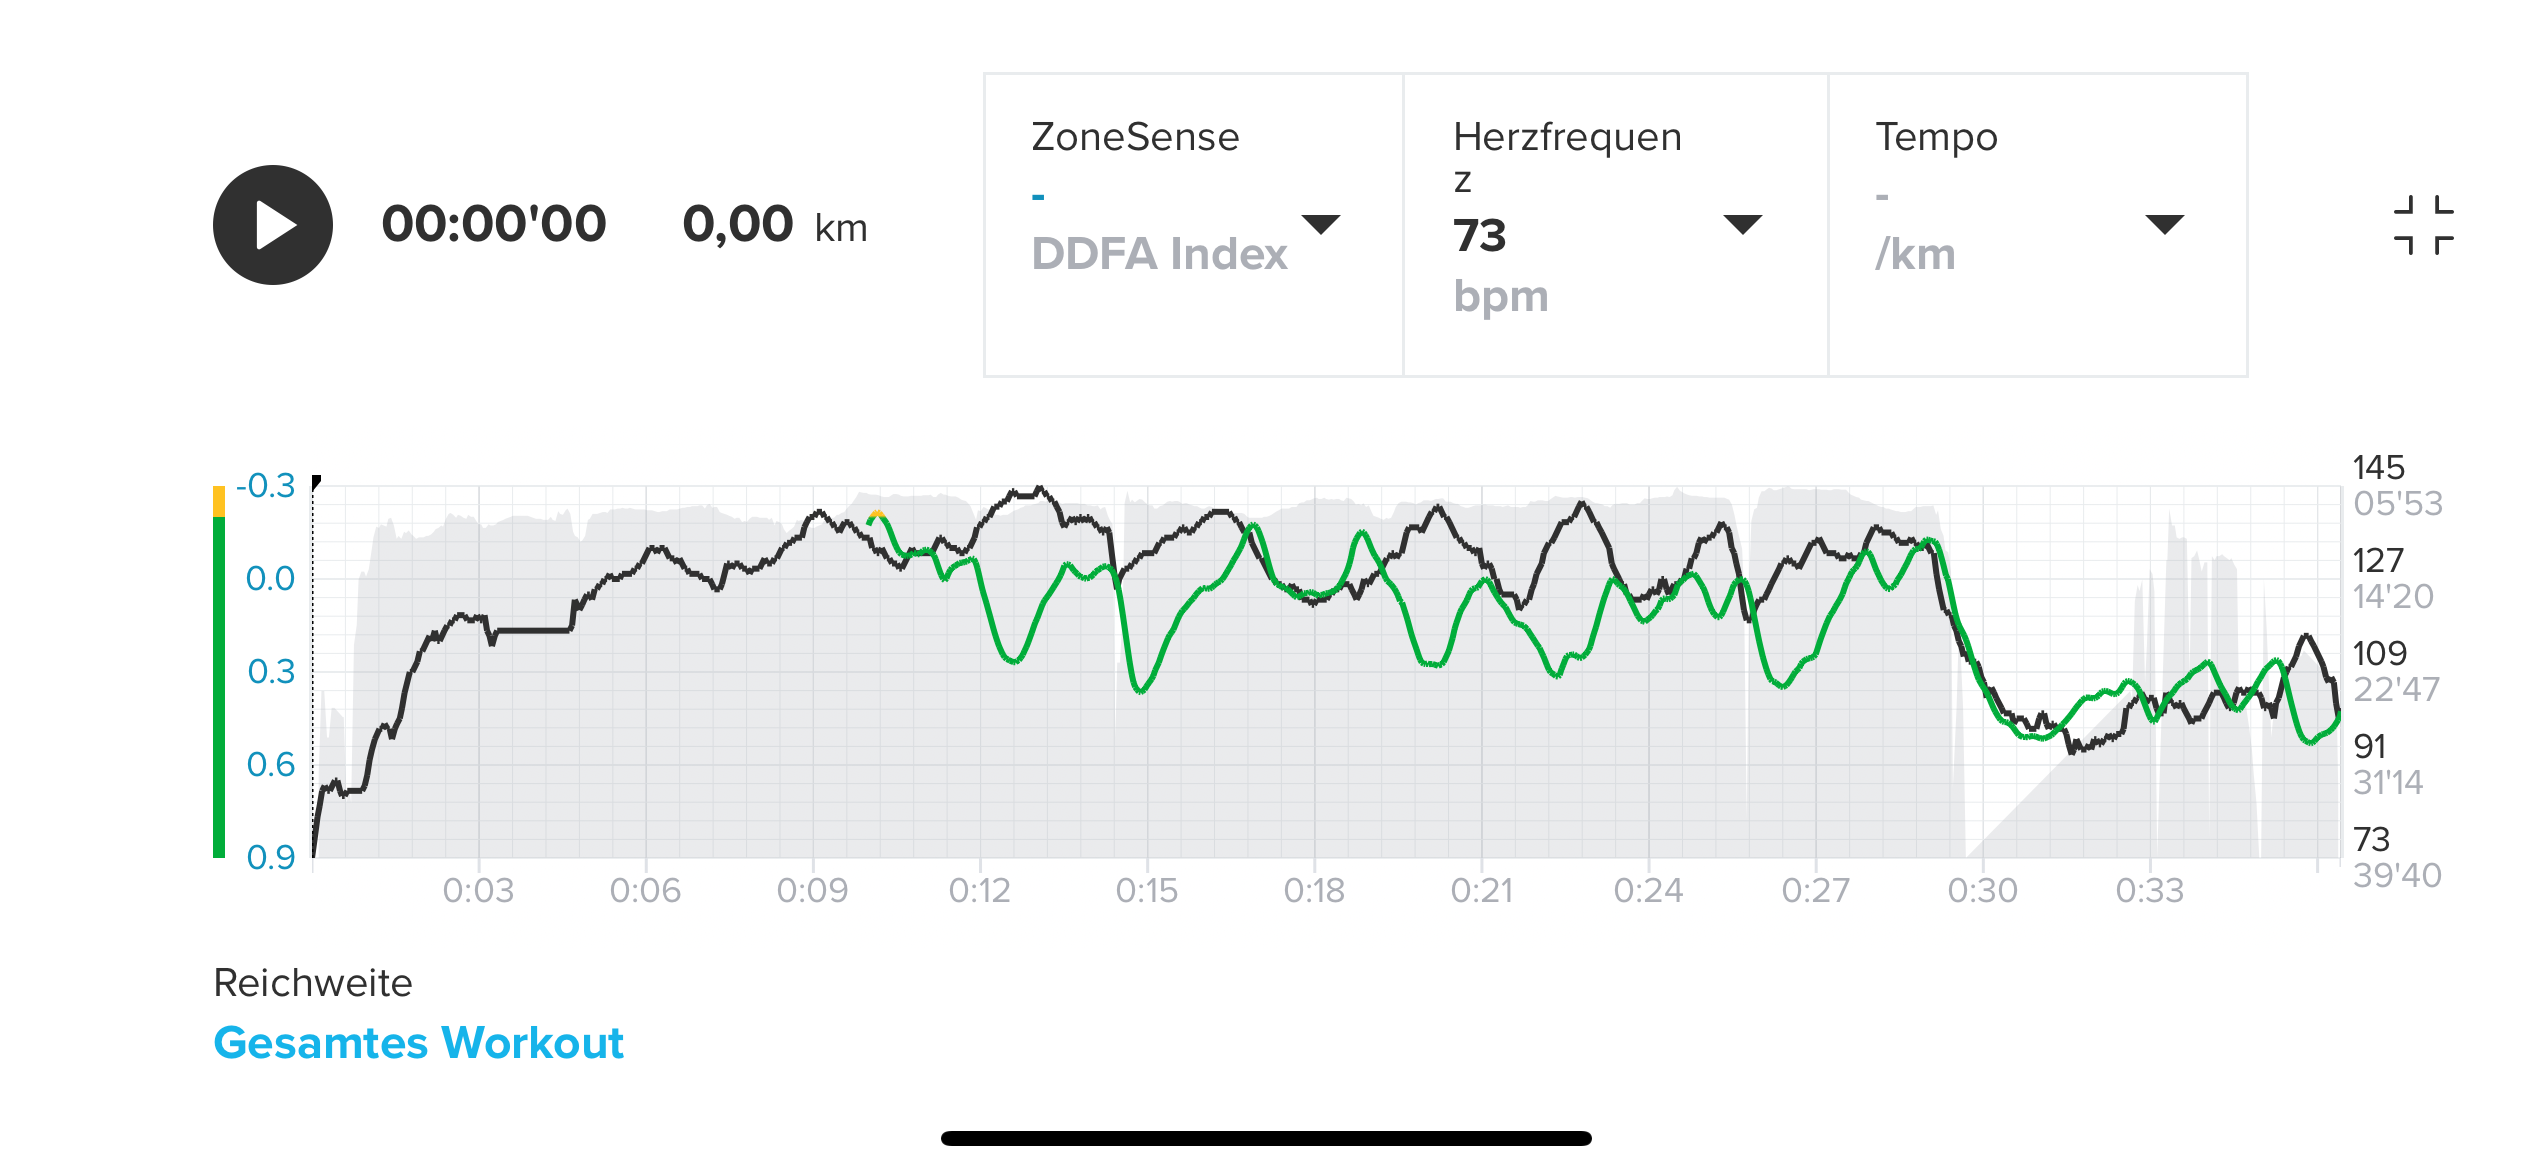
https://www.strava.com/athletes/37982563
https://www.instagram.com/macdev -
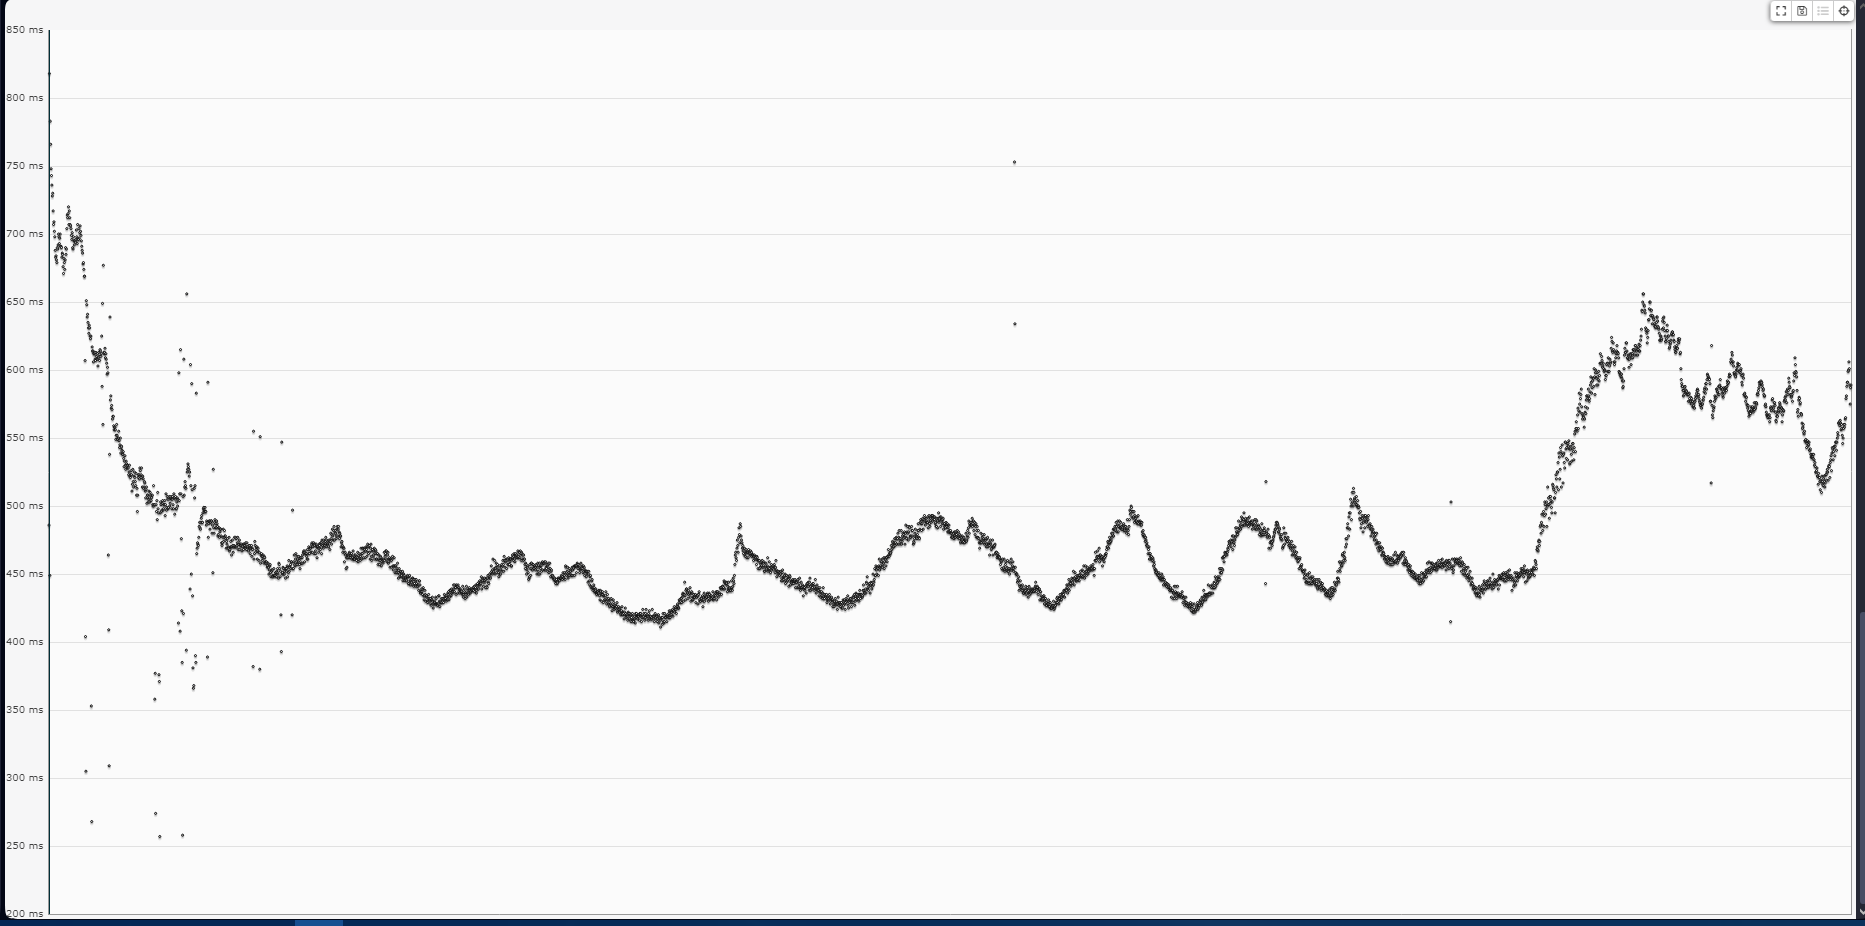
Here the “raw” data vizualized in runalyze for the first run (latest). I think the chart map better to each other. So maybe there is some kind of shift in the app.
Hello! It looks like you're interested in this conversation, but you don't have an account yet.
Getting fed up of having to scroll through the same posts each visit? When you register for an account, you'll always come back to exactly where you were before, and choose to be notified of new replies (either via email, or push notification). You'll also be able to save bookmarks and upvote posts to show your appreciation to other community members.
With your input, this post could be even better 💗
Register Login