Suunto ZoneSense
-
@pilleus said in Suunto ZoneSense:
Import your training from Suunto to QS
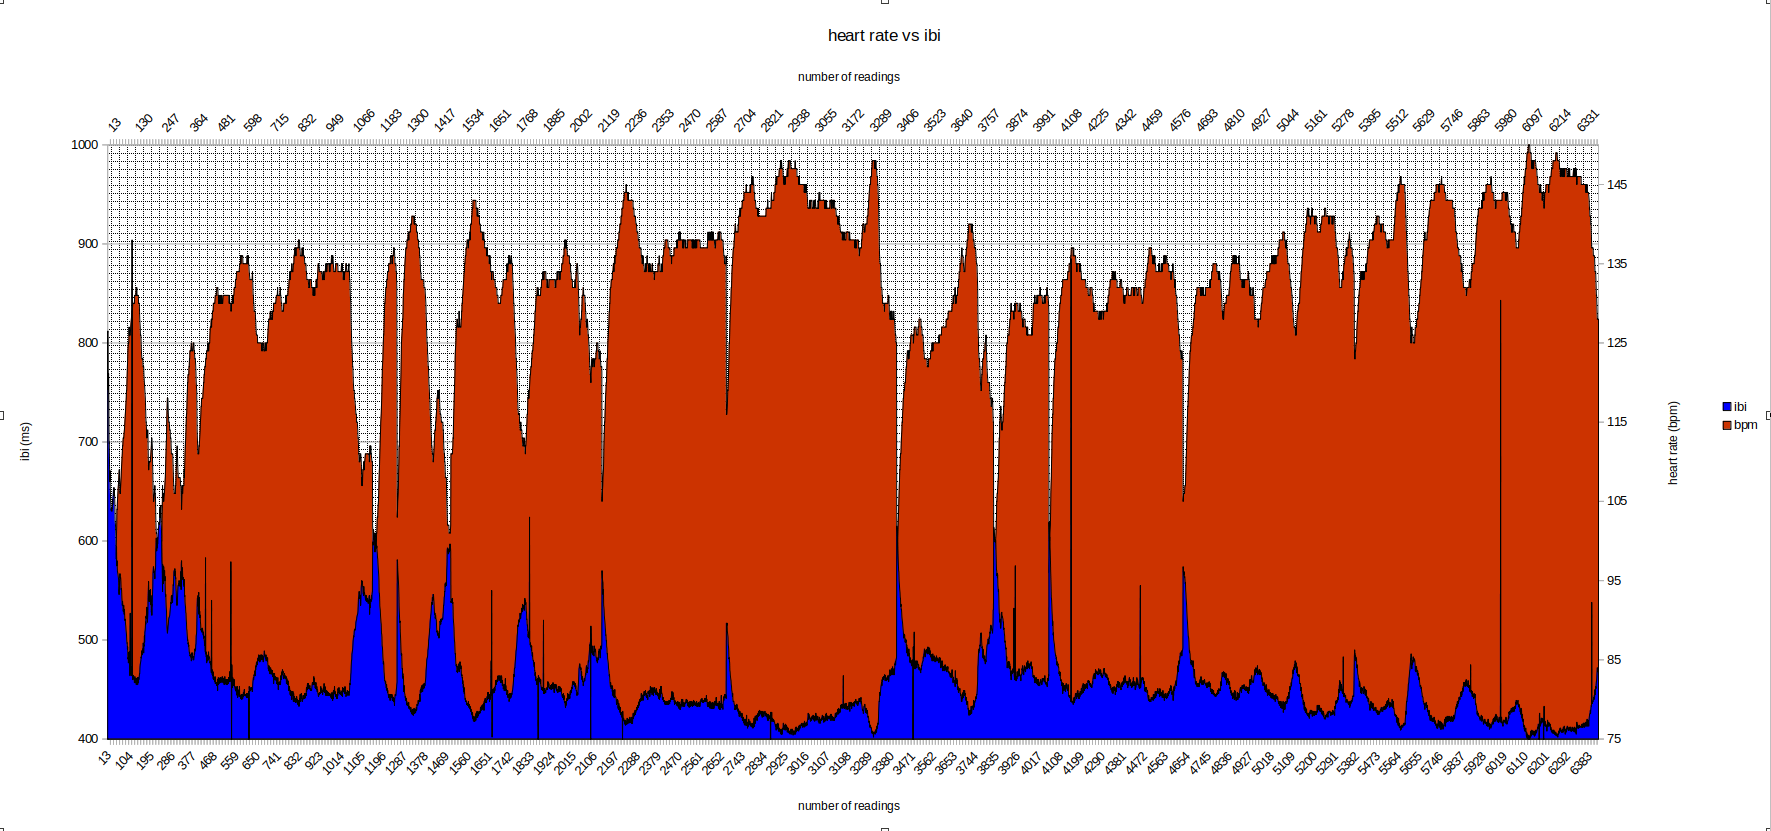
Without QS you can convert your Suunto fit file into a csv file and plot the hr and ibi data into a chart, where you can see the corralation of both charts (the misreadings can be seen clearly).
-
@Egika, it’s good that Suunto is pairing with group of scientists to provide new insights using the data we capture with our watches.
Haven’t read the paper, but in practise, it seems that ZS could be a very good structured test with instructions in the fashion of “in the warm-up do this, then ramp efforts like this etc”, like tests that use blood sampling, only that you can get the same results as a laboratory but without the lab and the blood sampling.
This is a huge innovation.
But the usage of ZS as a metric on totally uncontrolled environment during the activities (and post-workout on SA), for me (and for many others), is totally unintuitive and unstable.
To conclude, I think that ZS will give more value to a lot more people if it can be coupled with some structured test or at least structured instructions for us to do, and with the results we can update our zones, either a 5 or a 3 zone model.
-
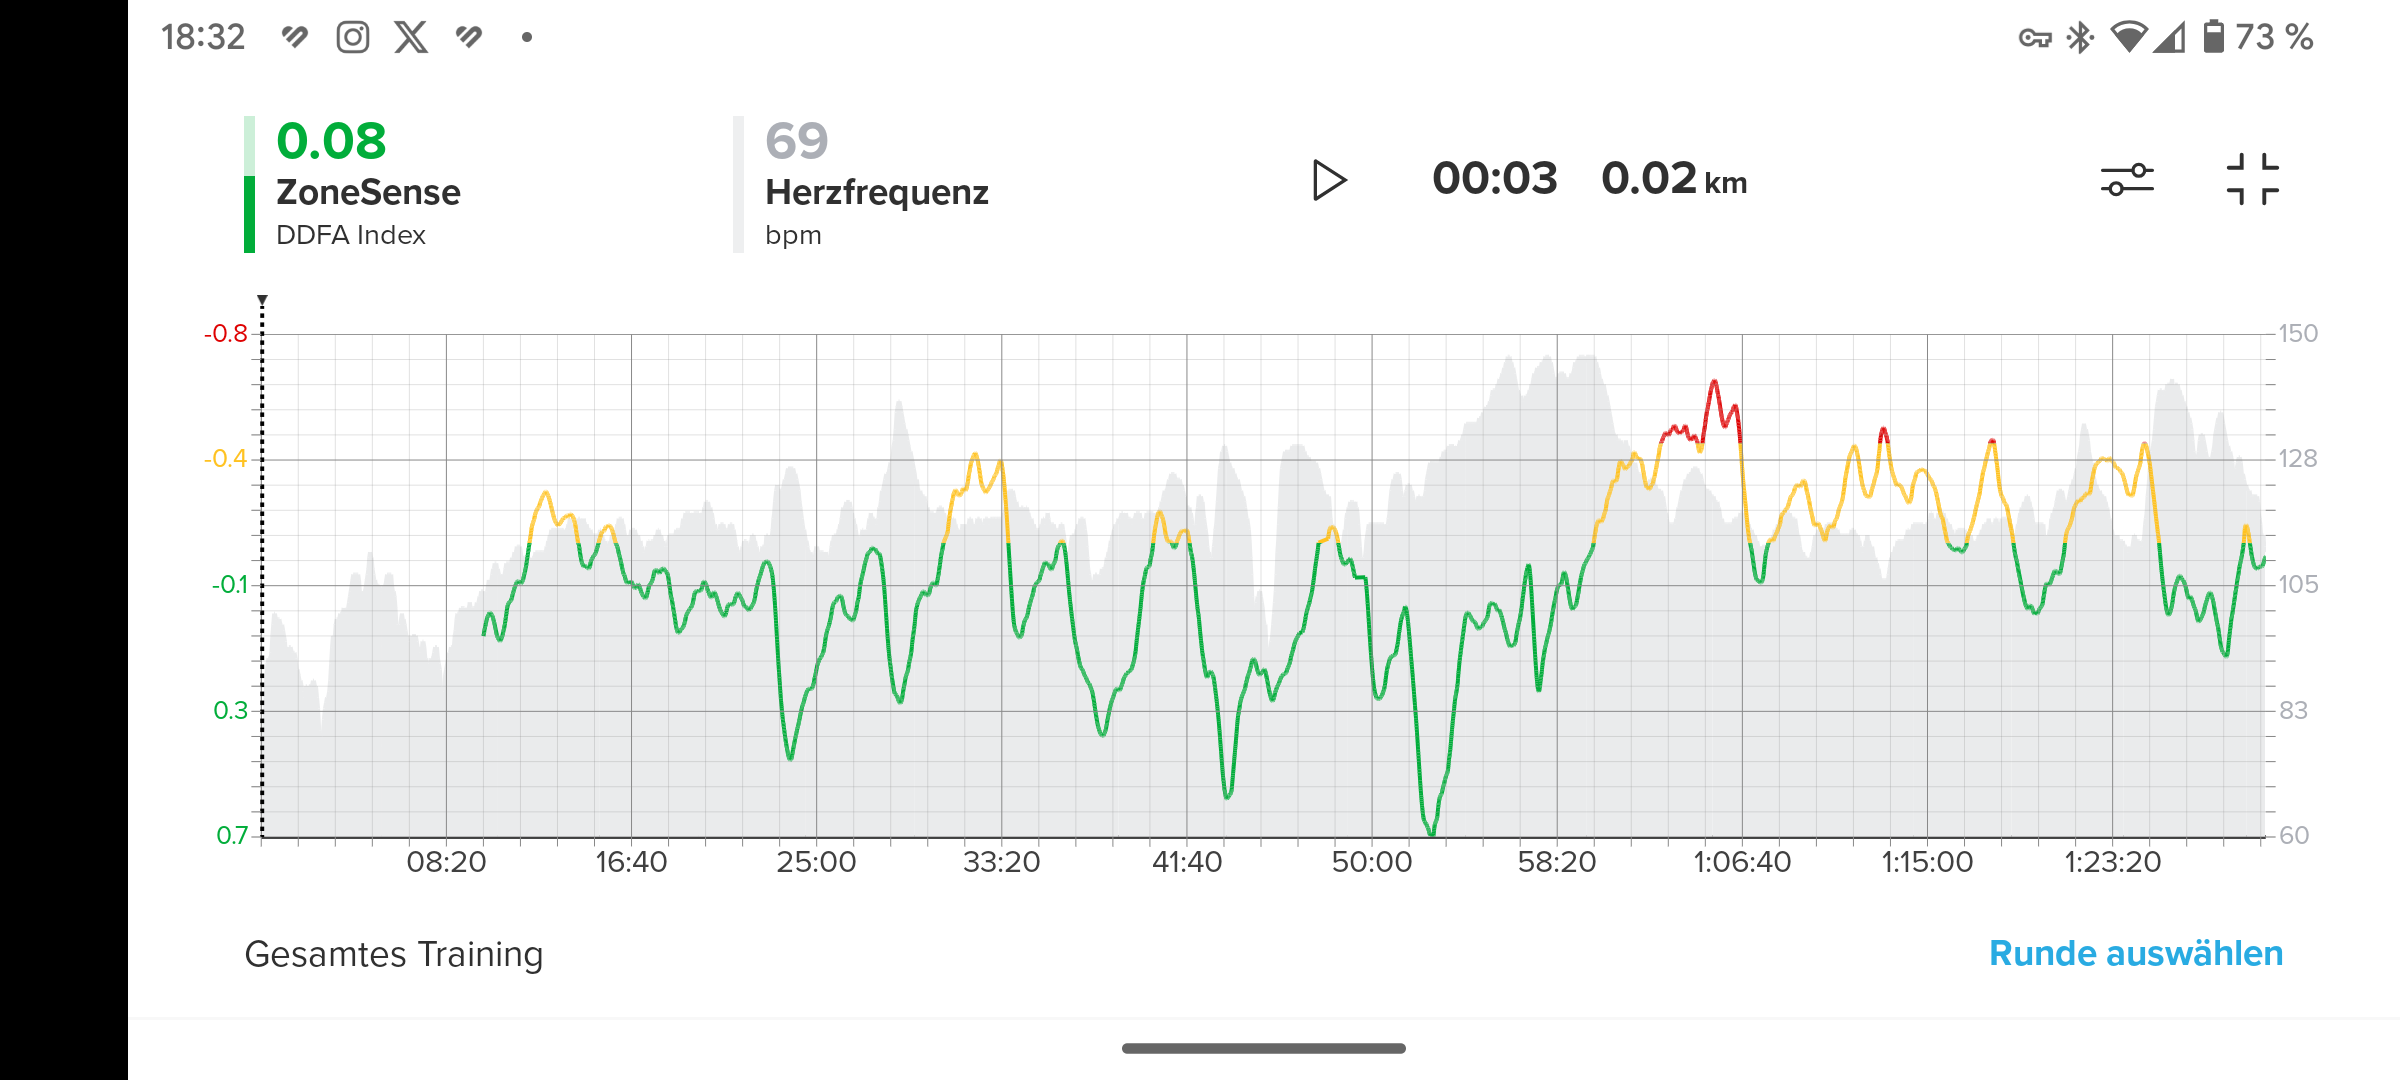
Since I either have to climb 75 meters or descend 35 meters before I reach flat terrain, I only started recording my activity in the valley today to give ZoneSense a good baseline for the first ten minutes.
This worked well and over the course of the 40 km bike ride on the single speed, ZoneSense’s live display seemed conclusive to me, apart from two or three peculiarities.
Sprints (into the anaerobic range) were displayed slightly delayed on the live scale, a hard sprint on the way back with a headwind (into the VO2max range) was also displayed as a red zone with approx. 4 minutes.
After that, however, I cycled at a constant speed and heart rate for about 5 km (about 1:15 in the chart) on flat terrain and the live scale went into the red zone three times before quickly falling back into the low yellow zone. I’m not quite sure what happened there. It’s not so clear in the app display.
It is also unclear to me why the anaerobic and VO2max thresholds are explicitly displayed as xxx bpm (value) in the details of one workout, but not in another.
https://www.instagram.com/moves.are.life/
Suunto Vertical Black Lime
Suunto 9 Peak Pro Black
Suunto Spartan Ultra Stealth Titanium -
@mlakis said in Suunto ZoneSense:
@Egika, now we can speak.
The need for stable cardiovascular condition and the too slow sample rate, in addition to the first minutes where it calibrates, mean that ZoneSense can be a good test to determine zones, threshold etc, where the person to be tested is given instructions on what to do and how to structure his/her efforts.
For normal efforts like training, racing, free riding etc it seems a very unstable metric where you can draw no conclusion on what your heart/body is doing.
The intent is not to test your HR zones. But, for endurance efforts to use ZS instead of HR zones as your AT will vary depending on fatigue, effort, etc in real time. For me during normal runs and ultra races it is incredibly useful. I think you misunderstand the intended usage. I will not need to monitor or set HR zones again! I will use ZS and supplement with RPE.
Vector/T6c/Ambit 3 Peak/S5 Copper/S3/S7 Ti/S9 baro Ti/S9P Ti/S9PP Ti/Vertical Ti/Race Ti/RaceS/Ocean/Wing/Race2Ti
-
@pilleus “It is also unclear to me why the anaerobic and VO2max thresholds are explicitly displayed as xxx bpm (value) in the details of one workout, but not in another.”
Aerobic and anaerobic thresholds are displayed on your workouts when either one of them or both were successfully measured by the ZoneSense algorithm. It won’t be measured in every single workout, you have to spend time on the next zone to get threshold measured, it’s been said that usually at least 5 mins it’s a safe number, however only if that day you’re indeed crossing that threshold value, e.g. if you’re well rested or fitness is getting better, to name a few, threshold can be higher(or lower) that you’d expect. That’s one of the biggest selling points of ZS, it takes in consideration your daily heart stress level recorded during the baseline and adjust efforts zones (aerobic, anaerobic and VO2max) dynamically.
-
@herlas said in Suunto ZoneSense:
you have to spend time on the next zone to get threshold measured, it’s been said that usually at least 5 mins it’s a safe number
I understand, I think it was also explained in the Suunto introductory video on YT. And it was mentioned that you should pay attention to your heart rate at shorter intervals, as ZS will not react as quickly.
It is only difficult with the live display on the watch. I set the speed and heart rate option on the ZS display to see that I’m riding at a constant speed and heart rate on the flat. But today the live display went up and down across all three zones in ZS.
This would mean that if I want to ride aerobically, when this happens and the display goes up, I would have to ride slower, when the display goes down, I would have to ride faster.
That doesn’t seem quite logical to me yet.
-
@Brad_Olwin, well since I don’t understand, upload a screenshot from an endurance activity of yours with ZS and HR plotted and explain to me how you used ZS, because from mine and of other’s activities that are posted here, even from those from Suunto’s initial release, it seems that ZS numbers are totally counterintuitive, because ZS drops when effort ramps up and goes up when effort ramps down.
-
FYI, S+ ZoneSense has been recently updated.
According to the Suunto Community channel on telegram (in spanish), initial reported bugs have been addressed.
Bugs fixed mentioned include :
*Multiple arrow indicator issues such as, it gets stuck, it’s shown at the center of the screen.
*text “waiting for data” continues to be shown after the 10 mins warmup/calibration ends.
*zone colors or arrow indicator are missing.
*differences between real time analysis and SA after the fact.
*S+ ZS should work better now when using a second app at the same time ( S+ climb has special workaround, see below)
If using S+ climb together with ZS:
Enable S+ climb after the10 mins warm-up is completed and ZS shows the zones with colors.Also, it was recommended to uninstall S+ ZS, sync watch, double check S+ is gone from watch pre-workout menu and install it again.
Might not be needed but to be on safer side.
-
@mlakis said in Suunto ZoneSense:
@Brad_Olwin, well since I don’t understand, upload a screenshot from an endurance activity of yours with ZS and HR plotted and explain to me how you used ZS, because from mine and of other’s activities that are posted here, even from those from Suunto’s initial release, it seems that ZS numbers are totally counterintuitive, because ZS drops when effort ramps up and goes up when effort ramps down.
I’m not Brad but I just used ZoneSense during my 100 miler to pace it and it worked pretty darn flawlessly. There is definitely some lag on what’s reflected in the watch (ex big climbs taking a few moments for the arrow to jump into yellow).
I’m not yet sure how useful it will be for interval type efforts but I would absolutely use it for any effort where some restrained pacing is required.
Always carry a flaggon of whiskey for snakebite; and furthermore, always carry a small snake.
User of pretty much every watch since the Ambit 3 Peak. Now back in the family w SV :)
-
@stromdiddily graph please
-
@mlakis said in Suunto ZoneSense:
@Brad_Olwin, well since I don’t understand, upload a screenshot from an endurance activity of yours with ZS and HR plotted and explain to me how you used ZS, because from mine and of other’s activities that are posted here, even from those from Suunto’s initial release, it seems that ZS numbers are totally counterintuitive, because ZS drops when effort ramps up and goes up when effort ramps down.
This is my entire point! Hopefully I can explain better. I am not examing my HR and ZS plots after my run, I have CTL TSS and TSB for that. During my run I use the ZS app and monitor whether I am aerobic or not. On an endurance run I will keep ZS in the high green and low yellow. For recovery runs green only. For tempo intervals mid to high yellow. in the app I relate my RPE with what ZS suggests for my AT, which is at my-expected threshold if I am well recovered and feel good or lower if I am fatigued. I use ZS in real time to manage my effort and use this for races as well.
Examing the graphs after the fact is not what ZS is useful for. If I am doing shorter and harder intervals I will use power, not ZS.Vector/T6c/Ambit 3 Peak/S5 Copper/S3/S7 Ti/S9 baro Ti/S9P Ti/S9PP Ti/Vertical Ti/Race Ti/RaceS/Ocean/Wing/Race2Ti
-
@stromdiddily exactly my usage as well. Congratulations on your race!
-
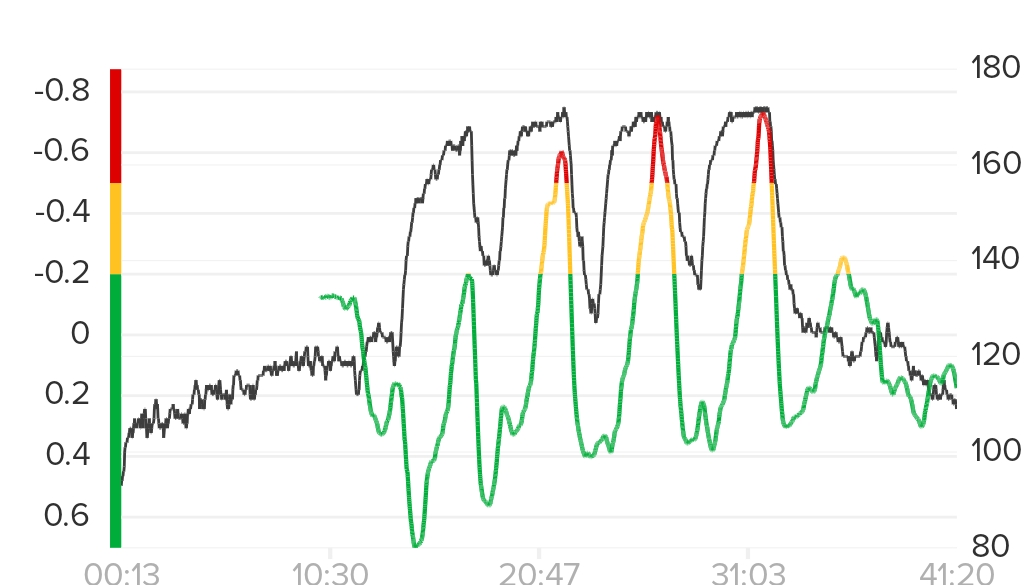
Hat I could tell is the folllowing
Most of the time Zs works fine, I saw however few runs at high intensity (Wednesday is my vo2max day) where Zs stay in green
When I look to the rr data in runalyse after I see looots of artifact (more than 15%)
I think it is working well when data collection is good.
@Brad_Olwin may I ask you which belt you are using ?
For those that complain did you look over your rr artifacts ? Maybe it could explain a bad behavior -
@Josaiplu how long are your Vo2max efforts? Well known that short intervals are not going to be represented by ZS, this is a known limitation.
400s on the track at Vo2max are a no go.
800s are better represented specially after 2nd interval but real intensity is represented on the last part only.For short interval should keep using pace or time not even HR
")
400s
800s
-
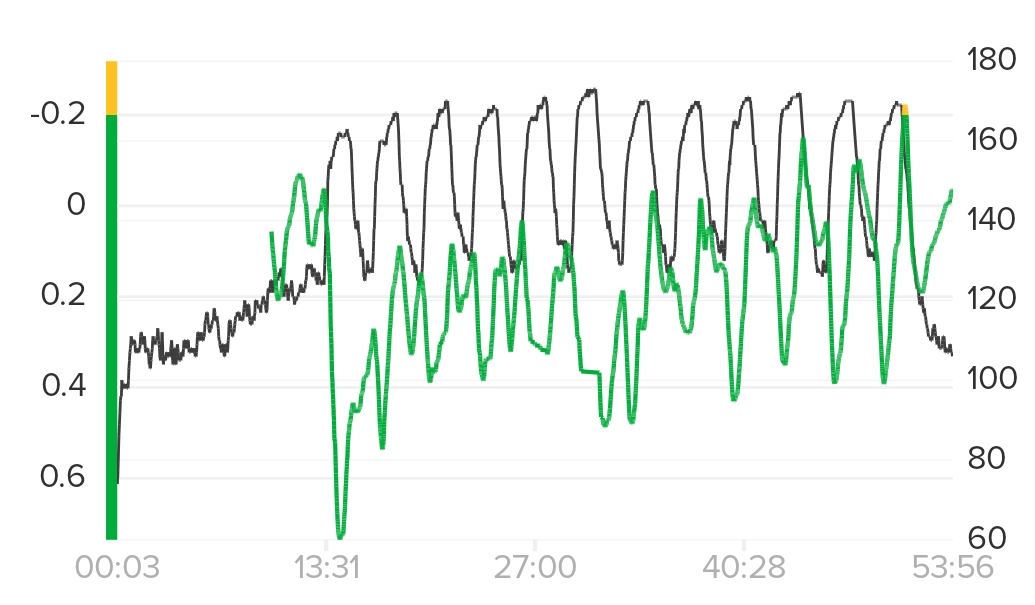
@herlas I know that I did not do 30-30 interval I go run for 1 v max out like it is a race, sometime I walk if I m out of breath or ascent is too high but it s a long max out race, I know it s not fully a vo2 max but sa put this tag on it and zs remain green on one of them
Example with low artifacts
Example with either artifact or bad fc detection
Last picture there is an increase in fc and zs go down for exemple
On my bike however I never get a bad detection so I think artifact could have an impact
In the past I watch a video that explain how to detect threshold using dfa1 and it is hard to do with running while on a bike it is easier because there is less artifacts -
@Brad_Olwin, no graphs yet.
I want a graph of ZS/HR and an explanation of how ZS helped you better than HR to pace your effort, in respect also to how many times the ZS was showing nonsense and instead of helping you it was misleading you.
That’s what we are examining, what metric helps you better to pace you efforts.
So, graph please.
-
@Josaiplu your activities shown are not apple to apples right, in one you’re doing high intensity short periods vs the other it’s more sustained. Either way, I agree, if belt has issues it’ll throw off ZoneSense and if it’s that bad, even HR graph. you might need to replace your belt or sensor if this is happening frecuently, depending what your specific situation is and when completely sure that’s needed
 .
.ZS dropping to green after a quick change in effort, like increasing pace for an interval start is known and it’s expected AFAIK.
SRS Ti
SRun (primarily road runner so testing SRun is a must ;))
A3P (drill mode for pool swimming 🤦🤷)
Galaxy Z Flip 3 / Galaxy S24+ -
@mlakis said in Suunto ZoneSense:
@stromdiddily graph please
I don’t understand your graphs requirement to validate pacing guidance DURING the effort. Post workout, my ZS aerobic hr was 135. That’s ten beats lower than my entered zone 2 primarily because it was hot as heck and I was at elevation.
If I would have followed the heart rate zone, more than likely I’m blowing up because I’m working way harder on that specific day than I was when I set my zones originally.
It was a 26.5 hour activity. My graph isn’t going to help you.
Always carry a flaggon of whiskey for snakebite; and furthermore, always carry a small snake.
User of pretty much every watch since the Ambit 3 Peak. Now back in the family w SV :)
-
@herlas yes and I did not post to complain I like the feature a lot and use it most of the time my point was just for people that complain maybe looking into their data could explain strange behiavior
-
@stromdiddily, since we are talking about data/metrics, graph IS the data/metric, which should be the same during and after the workout.
If during a workout that is 1/2/5/24/72 hours ZS is showing nonsense in a large percentage of the duration in respect to when you could draw a useful conclusion, then it’s not useful.
HR, Power and their zones are metrics that give you insight about your effort further than your perception, even before you exert yourself. They go beyond perception.
A metric that shows me something meaningful 5% of the time that also agrees with my perception like when I can’t hit my usual numbers when it’s hot, if I am a bit ill, when I have overcooked myself the previous days or on the first hours of my activity etc, does not give me something useful, and also is misleading for the rest 95%.
So, I insist for graphs and an explanation on how HR or Power that are drawn/shown can’t help you in a better way than ZS can.