Suunto ZoneSense
-
@far-blue said in Suunto ZoneSense:
@dulko79 Anyone know if it will automatically update on the next watch SuuntoPlus sync? Or do you need to remove and re-add it?
-
@Mff73 Thanks for the link. I missed the original explanation post.

-
@mlakis here’s a lot of graphs with explanation:
https://www.suunto.com/sports/News-Articles-container-page/introducing-zonesense-revolutionizing-intensity-insights-with-heart-stress-measurement/And you might watch the lecture that has a nice marathon example with graph: https://youtu.be/bD3O4BZ9vIc?si=KkS3NTd2Lp7eS1Qt
-
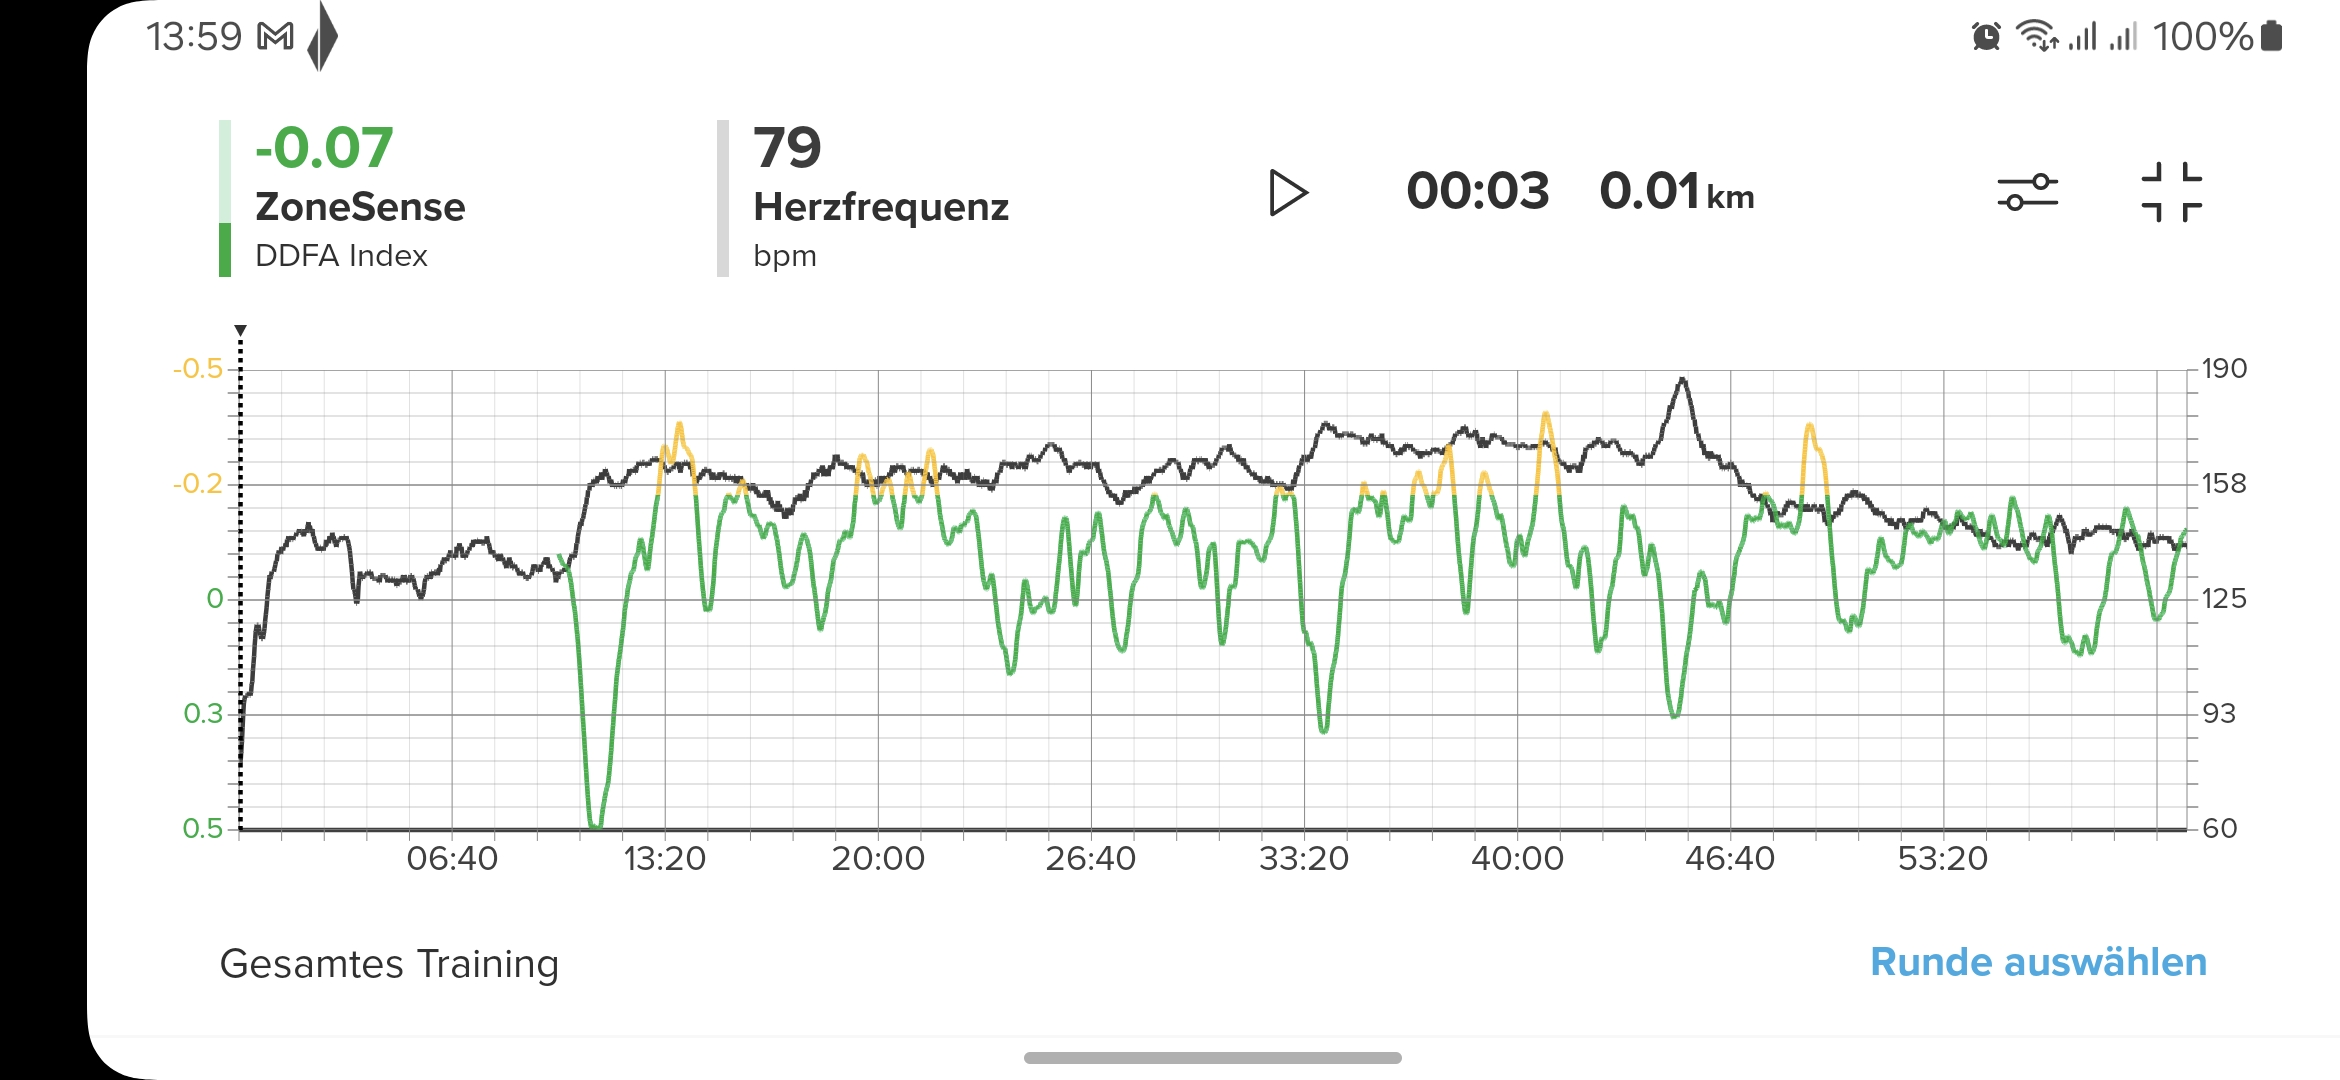
For me Zonesense doesn’t work at all. Had the third run today with first warmup, then about 30 minutes all out, then pushing up a hill until maximum Heartrate - then cooldown.

HR Zones where about 50% red in this run
I can’t see how this values can be of any use -
@VoiGAS what is your setup? (Vertical + Suunto belt here and work surprisingly well)
-
@mlakis there are great examples with cycling explained in the Suunto video. Have you watched it?
https://youtu.be/bD3O4BZ9vIc?si=wmJ2zJUIXQlp--NF -
@VoiGAS The warmup is not long enough for ZS and what are you looking for? What do you mean not working? What did the watch show? Your HR in the graph changes quite a bit and is not a steady value. An all out effort should ramp up HR then when done decline. The hill is much higher HR so prior to that cannot be all out.
-
@VoiGAS
I’ve been following this thread because my experience (for running) is the same as you: the ZoneSense output is not useful or credible as a measure of intensity for me. To rely on it I would have to ignore the frequent contradiction with other data showing what I’m doing (speed, gradient etc), how I feel (RPE) and how my CV system is responding (HR).I’ve read the Suunto article and watched the video. I can’t see any examples - for running - where pace and/or HR wouldn’t have been as good or better than ddfa, based on the data in the charts. I expected to see use cases where ZoneSense gives actionable insights that HR, pace or other established metrics do not. Maybe I’ve missed them or misunderstood the data presented?
-
@iterumtenta I have a Race S plus Suunto belt
-
@MKPotts Running trails, HR, Pace and Power do not provide actionable information on effort. HR on downhills if technical cannot run fast enough to use. Power is useless in sand, lots of rocks and roots as well as steep downhills power is low but effort is high. Pace is not helpful either, on steep uphills very slow and on technical downhills hard to go fast if a pace target is set.
ZS on uphills I use to keep my effort in check. Surprisingly on downhills I see anaerobic efforts where I know I am working but thought I was aerobic. As I stated before, much better than any of the other metrics for me on trails and I think on long runs or ultras later in the run will help me gauge effort better. -
@Brad_Olwin I had about half an hour in the upper treshold zone and then pushed to my maximum heart rate. Warmup was also running up the hill, so quite high.
My expectation was to at least reach the red zone in Zonesense. If such a workout doesn’t make it, then I have no idea how I ever can reach Zonesense VO2MAX -
@VoiGAS Zonesense needs about 20 min of aerobic to get a good baseline. For me it starts in about 15 min after I start running. Did you reach the red zone on the watch? I have several times but the time in VO2M has been short enough it does not show on the graph.
-
Több, mint 10 edzést végeztem már ZoneSense-vel. Előtte elolvastam mindent a témában, amit találtam, azt hiszem értem mit jelent. Elfogadom hogy a metabolikus küszöbeim napról-napra és akár egy hosszabb edzés vagy verseny alatt is változhatnak. A Suunto azt mondja, hogy a ZoneSense használatával tevékenység közben valós időben láthatjuk, hogy a küszöbökhöz képest a pillanatnyi erőfeszítésünk hol helyezkedik el. Edzés után, ha átléptük valamelyik küszöböt, az applikációban láthatjuk a mai napon mért küszöb értékeket. Ez nagyszerű dolog lenne, de a valóságban az alkalmazás nagyon rosszul működik. Például a mai kerékpár edzésen 3x10 perc anaerob küszöb (LT2) alatti intervallumot, 10 perc könnyű pedálozást és végül 40 perc LT1 alatti (küszöbhöz közeli) szakaszt szerettem volna végezni. Ehhez jó segítség lenne a ZoneSense valós időben mutatott adata. Az első 3 darab 10 perces szakasznál jól működött. Az inetrvallumok második-harmadik percétől kezdve elérte a vörös zónát (LT2 felett) és abban is maradt. A terv a sárga zóna legteteje lett volna, az én hibám, hogy a vörösben tartottam. A probléma a 40 perc aerob zónában tervezett szakasszal volt. Egyenletes 130-135 bpm között tartottam a pulzust. Az órán (Vertical) a ZoneSense felváltva a zöld a sárga és a vörös zónát mutatta, de legtöbbet a sárgát. Ez meglepő, mert érzésre és a beállított zónáim szerint is (pulzus és teljesítmény) LT1 alatt voltam. Edzés után az alkalmazás szerint a ZoneSense az aerob küszöböt 147, az anaerob küszöböt 154 értékre mérte. Ha 147 az aerob küszöböm a mai napon, akkor miért mutatott menet közben állandó 130-135 bpm-nél sárgát? Melyik a helyes? Ha az utólag számított 147 a helyes, akkor azzal semmit sem érek, mert menet közben helytelenül mutat az óra, nem azt az edzést csináltam, amit szerettem volna. És a holnapi hosszú aerob edzést sem tervezhetem a 147 alapján, mert ez változhat napról-napra, mért már 138-at is pár napja. És így holnap sem azt az edzést fogom csinálni, amit szeretnék. De ezt csak utólag fogom megtudni. Azt nem értem, ha az óra menet közben észleli a küszöböt, miért nem mutatja meg egy konkrét számmal. Ahhoz lehetne viszonyítani. A ZoneSense skála 1-3 perc késéssel jelzi a változásokat, és a tapasztalataim alapján helytelenül. A felhasználó csak azt látja az órán edzés közben, hogy valamikor átlépte a küszöböt, de nem tudja, hogy 1 perccel ezelőtt vagy 2 percel ezelőtt, és mi volt az az érték amit átlépett. Az elmélet nagyon jó és hasznos is lehetne minden felhasználó számára, ha jól működne. Jelenlegi állapotában viszont csak egy nagyon félrevezető adat, semmi több.
-
@Brad_Olwin Thank you for the hint - I will try a longer warmup. At least Suunto App and Watch were consistent after the latest update. Thats good and I also like the fact Suunto is bringing something innovative here. I just don’t know how I can make it work yet…
-
@Brad_Olwin said in Suunto ZoneSense:
Zonesense needs about 20 min of aerobic to get a good baseline.
If this is true (not saying it isn’t), then Suunto shouldn’t make the ZS data available in the app afterwards for activities that don’t meet this requirement. If, as the ZS defenders are saying, ZS is best for long endurance efforts, why even make the graph information available for other activities? It’s clearly causing a lot of confusion.
@VoiGAS said in Suunto ZoneSense:
Thats good and I also like the fact Suunto is bringing something innovative here. I just don’t know how I can make it work yet…
I think this is how most users feel at the moment. Seems Suunto has gone against their “simple is best” principle and put forth a metric that is either difficult for the average user to understand or perhaps just doesn’t work as intended. I’m currently leaning toward the latter as I’ve yet to receive relevant, actionable info from ZS during any of my activities.
@mlakis said in Suunto ZoneSense:
I want a graph of ZS/HR and an explanation of how ZS helped you better than HR to pace your effort
I don’t see any harm in asking for graphs from folks claiming it has helped them during an activity. Again, why give us the graphs in SA if we can’t analyze them after the fact? I believe @mlakis would like an example graph (HR and ZS) where the HR zone and ZS zones differ, but the ZS zone more closely matches how the user felt at that moment. Shouldn’t be too hard to produce.
Currently, we only have user examples where ZS makes no sense. And pointing to the Suunto produced examples doesn’t help as these have obviously been selected to support the theory behind ZS.
As a final thought, I’ll echo a sentiment I’ve read a few times above: ZoneSense feels very, very beta at this point. Suunto has some serious work to do if they want to make it beneficial to the average user.
-
To test, understand and try to get the most out of ZS for my training, I have ZS as main display on the Vertical during an activity.
The options in the middle to choose are enough and it would be a great feature if the three choosen options could be shown in a rotation every 5 seconds or so. So I would have all data on the ZS display without to press a button.
Or the outer ring of the ZS display with the three zones could be choosen on the other displays of the activity. Instead of the heart rate.
-
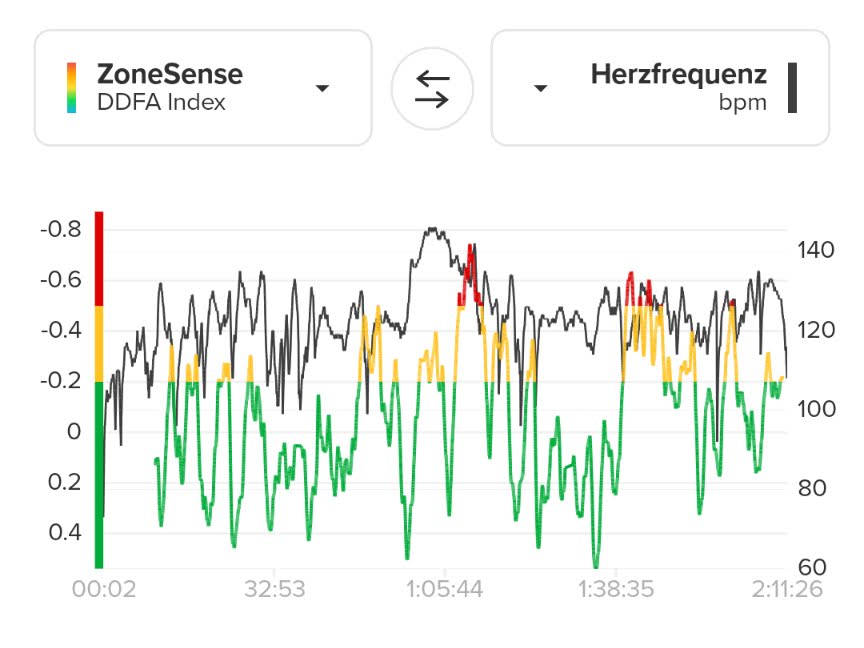
Today a workout on the kick bike. Should be aerobic, but it is difficult not to overpace. I was concetrated in the beginning, but after about 50 minutes there was some head wind, shown as yellow and red zone and in the end there was the gravel path which needs more power to kick and the uphill to my house.
ZS on the Vertical worked flawlessly and the graph is showing the corresponding results to my workout and feeling.
I think ZS will become my daily companion …


-
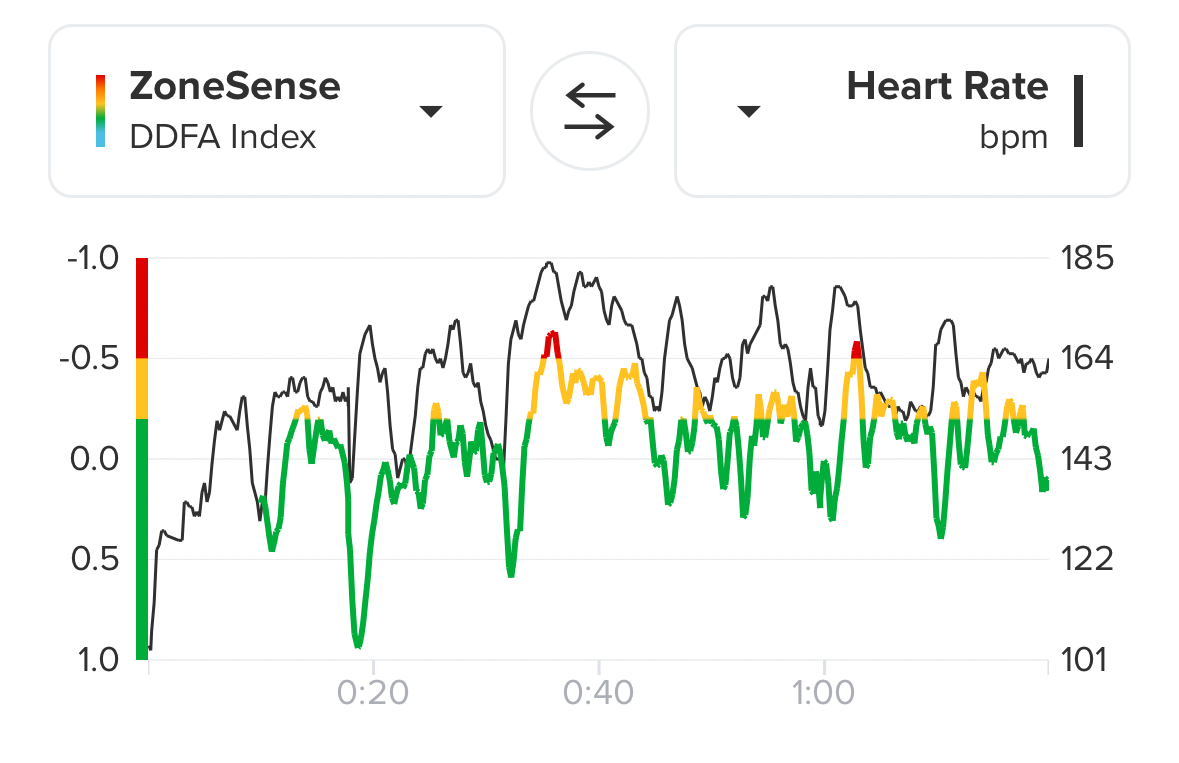
Here is a run today and I felt like crap as I had COVID and Flu vaccines yesterday. My AT was measured at 130, which is 12 bpm below my setting. You can clearly see on the uphill where I went into VO2M. I slowed down when this happened. If I was feeling normal would not have had VO2M. I have run this route 14 times, this was 3rd slowest . Matches what was on the watch. Also, note ZS starts about 15 min into the run.

-
@Brad_Olwin Wow, seems to work really good for you. I’ll keep trying
-
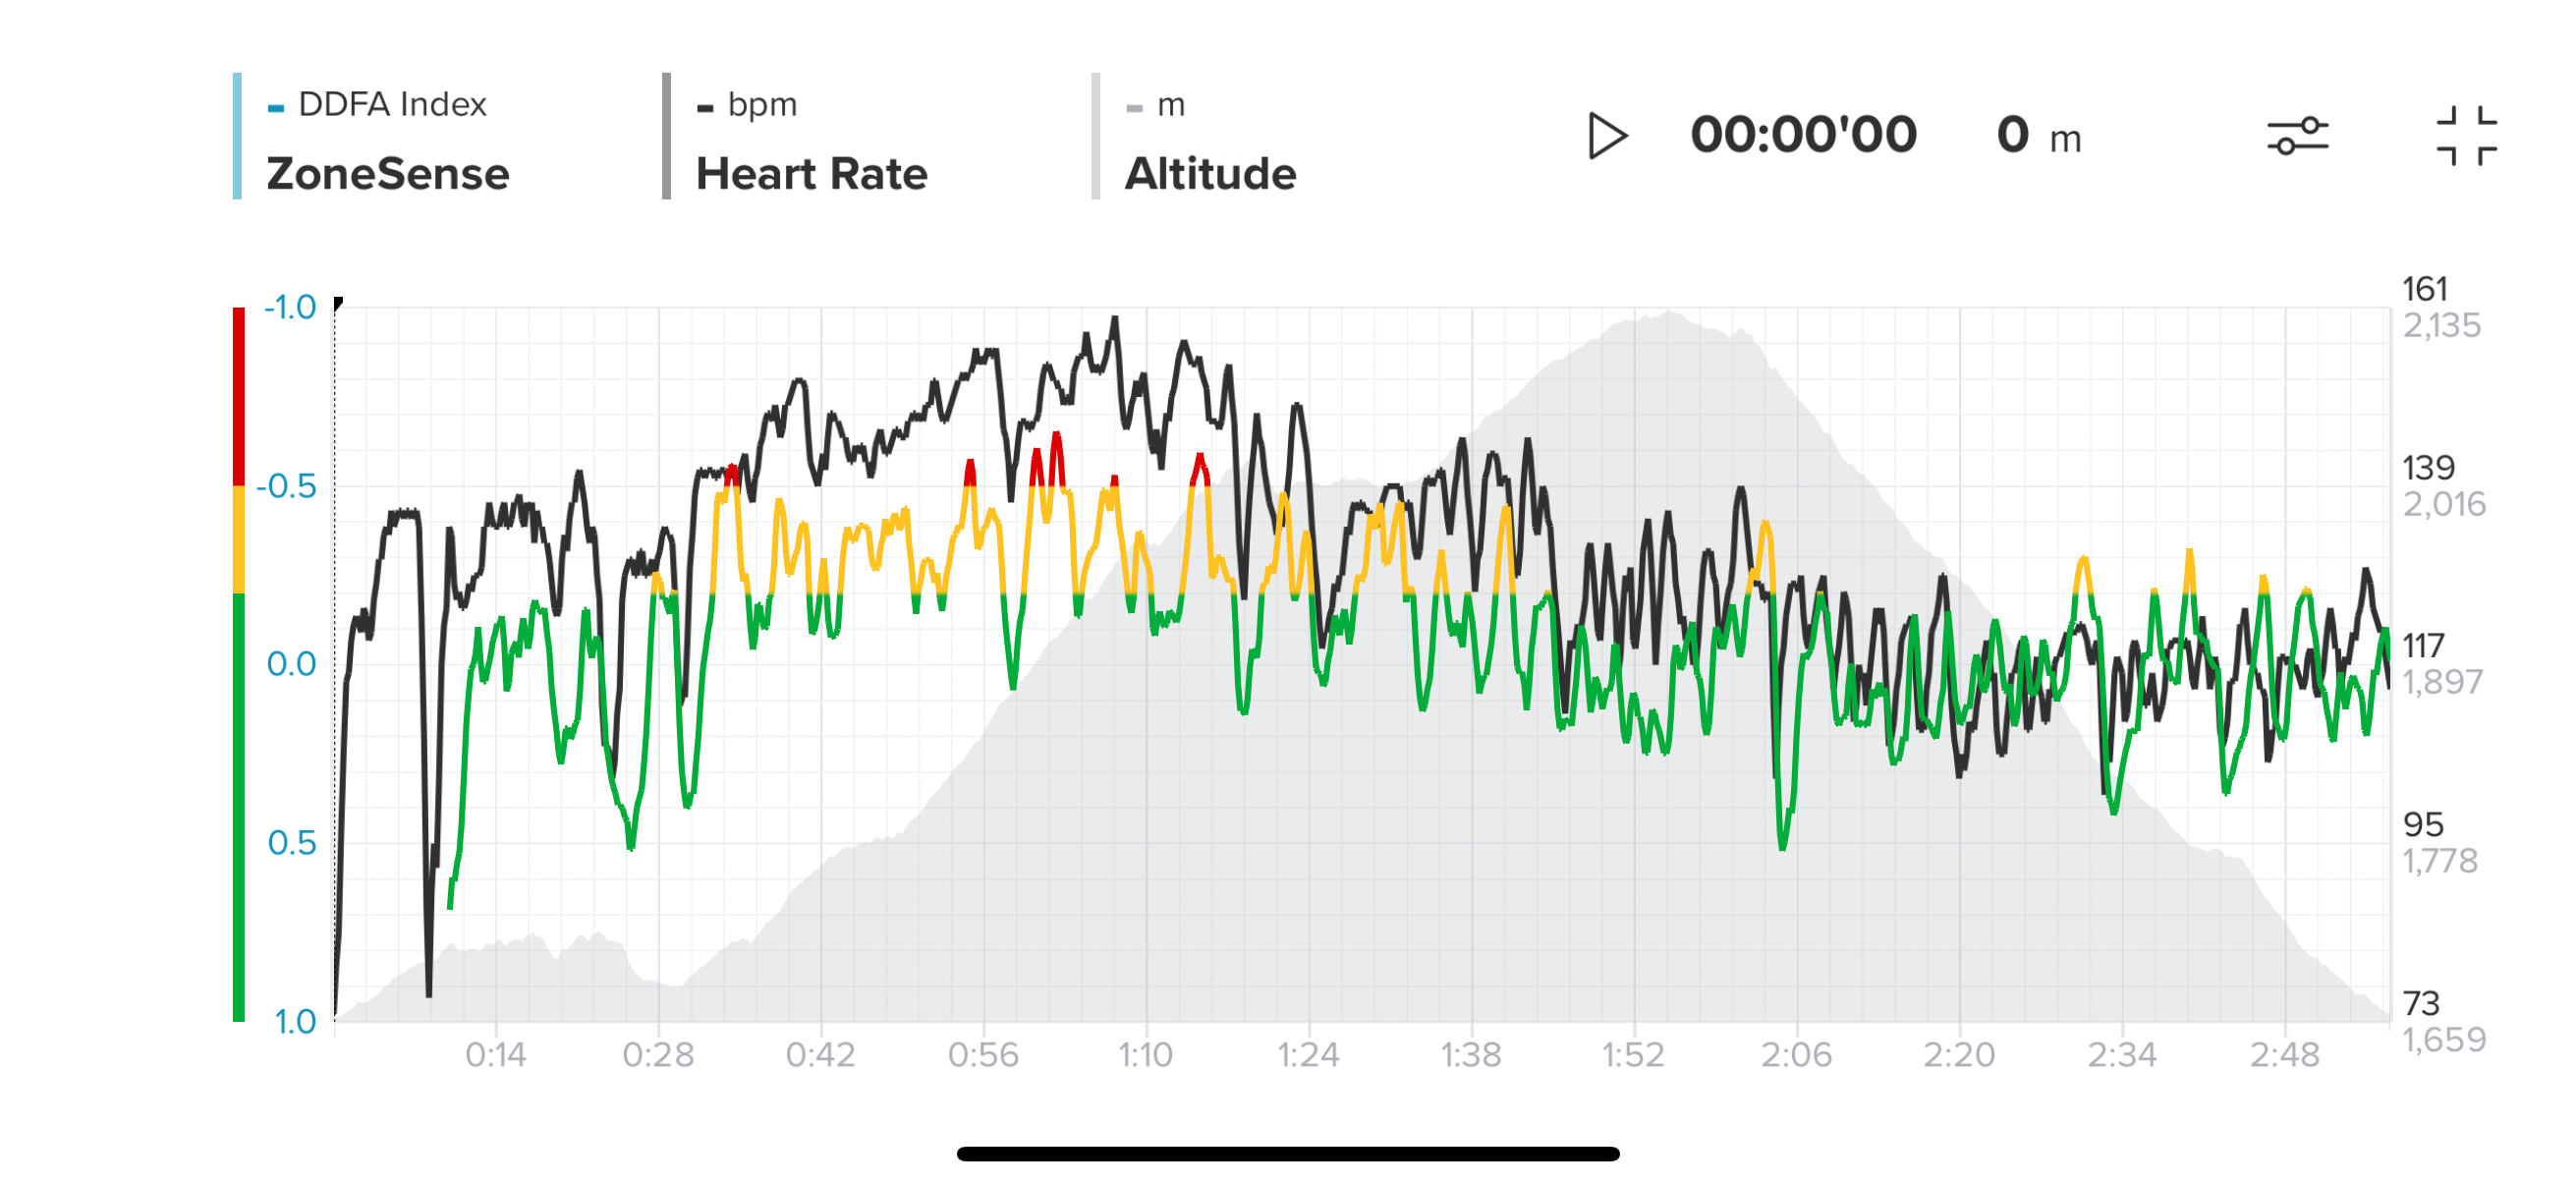
I did a small mountain run today with ZoneSense, and it was completely in line with my personal feelings, I find that this algorithm is a major breakthrough in my training. I’ve always been a bit overconfident when it came to applying RPE, but I feel that ZoneSense provides markers and builds a form of trust in the body’s signals for people like me, who lack a bit of experience in endurance sports. The RPE matches ZoneSense, which in turn aligns with RPE.
