Suunto ZoneSense
-
@iterumtenta Polar H10 for most runs. However, I’ve noticed that the HRV data on some of my activities has been pretty dirty according to Runalyze (lots of outliers). I just got the Suunto HR belt and only have a couple runs with it. The HRV data looks cleaner, but the ZS results are similar.
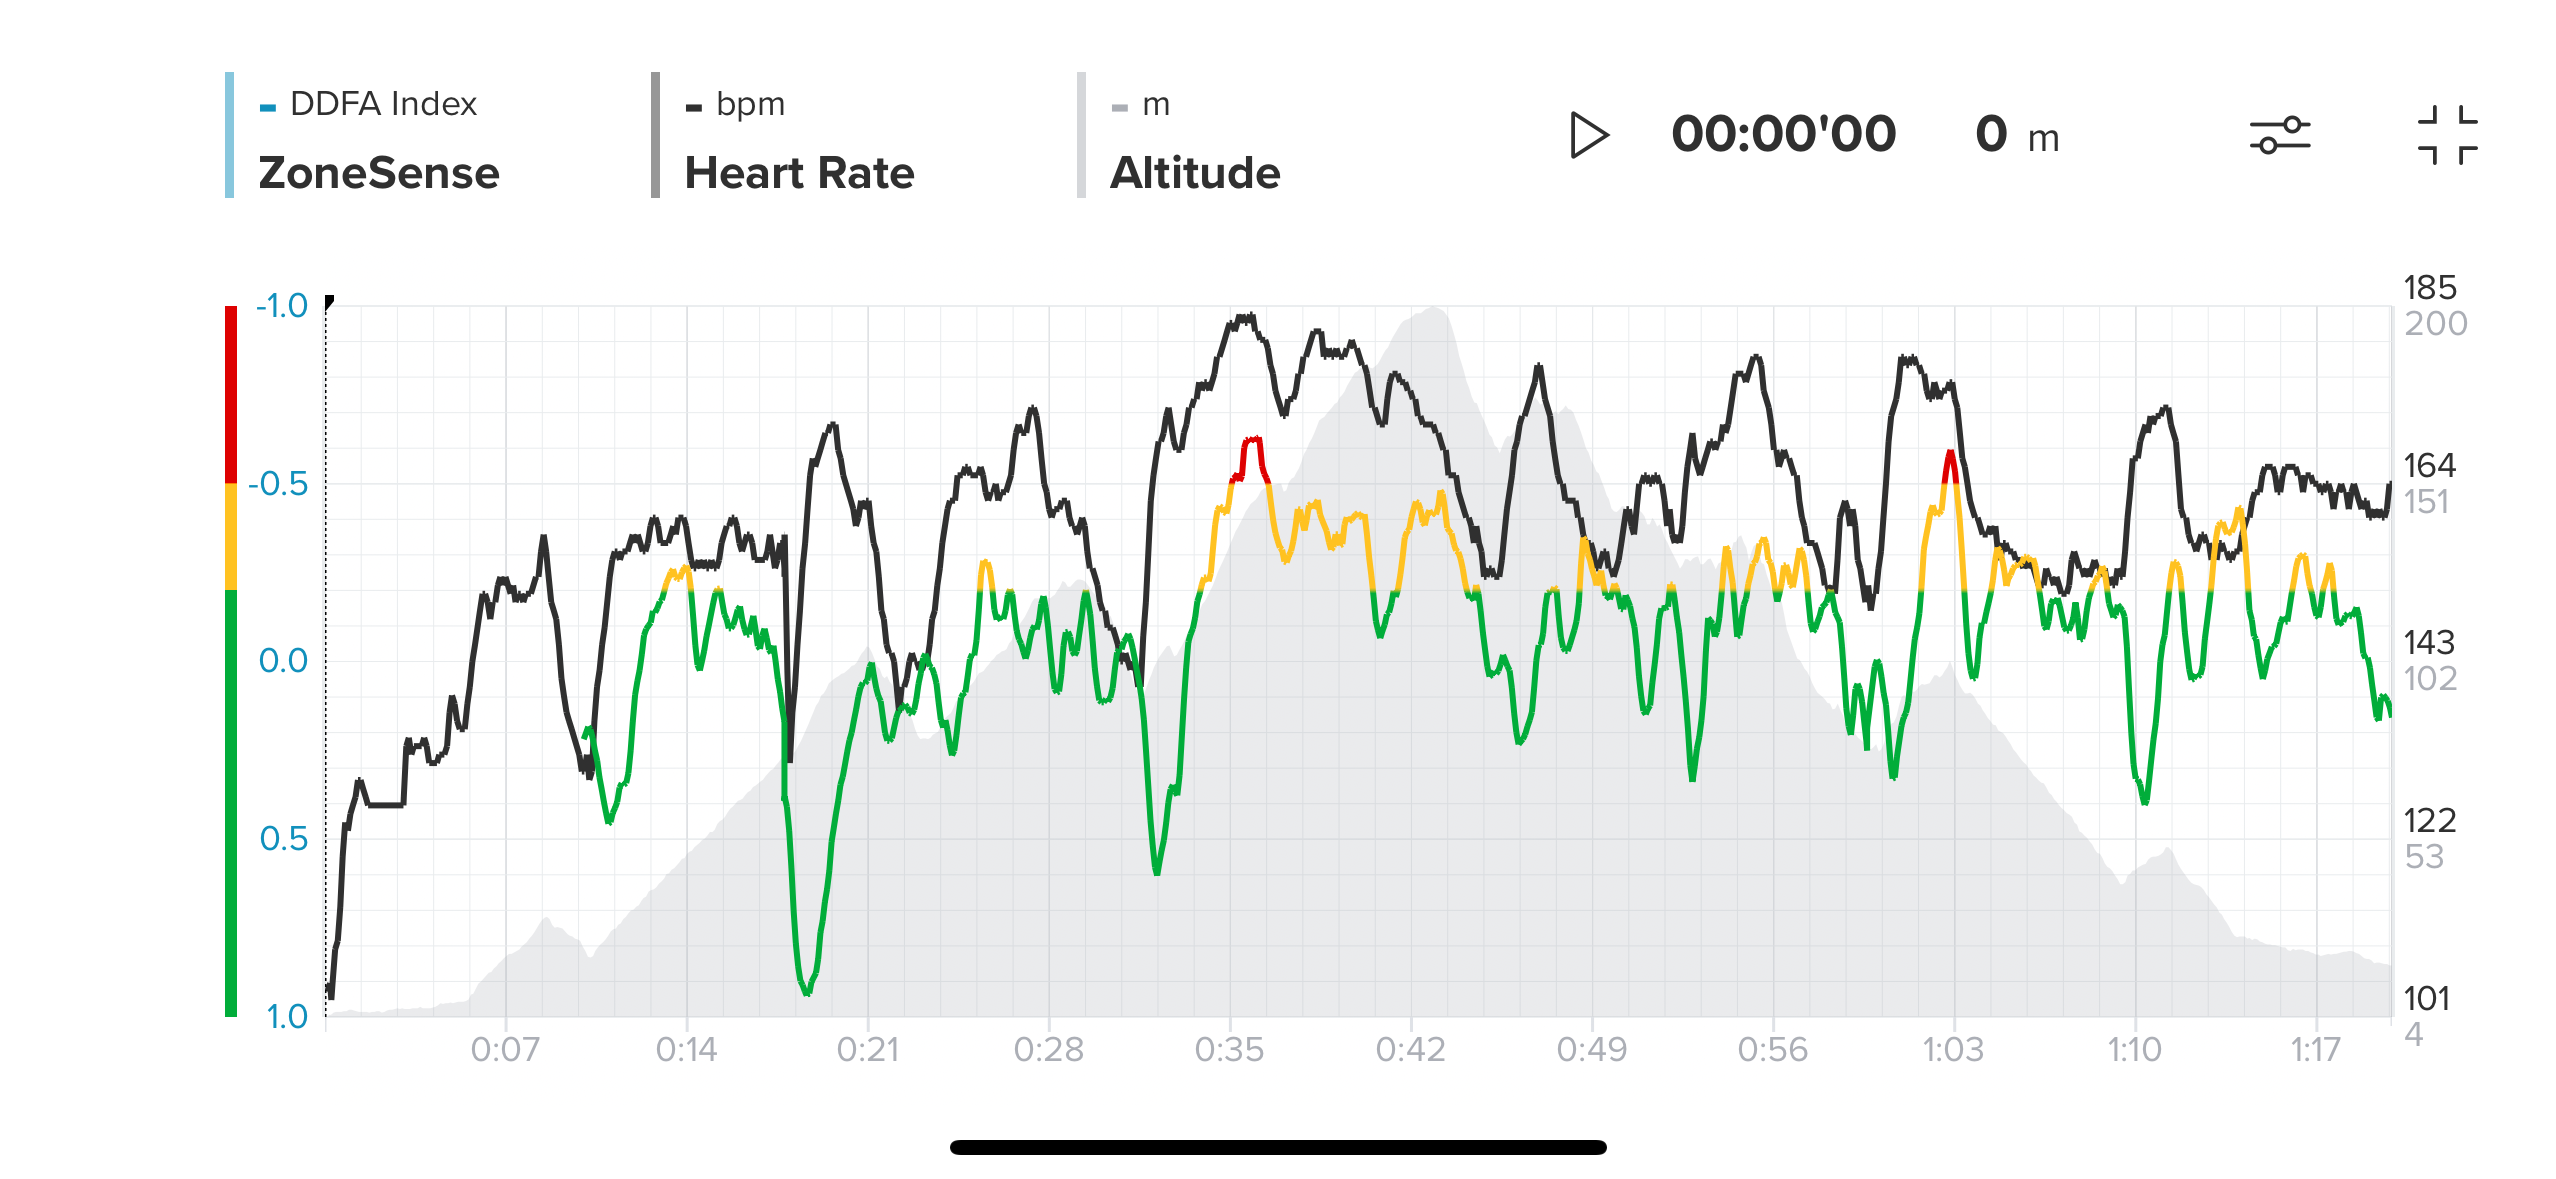
My main issue is the one pointed out by others above: As soon as I shift into a higher intensity, like the start of a steep uphill, ZS takes a nosedive and never catches up. You can see this on lots of the shared graphs. I thought this might be explained by the 3-minute data window, but that would only be relevant if my effort leading into the climb was extremely low, which it usually isn’t. I haven’t read a good explanation for why this happens. This is why I suggested a smoother algo to make the dips and peaks less severe.
-
The ZS app was updated 2 days ago. I uninstalled and reinstalled it to ensure I’m using the latest release. Otherwise, I’m not sure—maybe your suggestions could help.
-
@iterumtenta I can see a pattern I also have in my values: When HR goes up, ZS is going down. This seems to be pretty reliable.
But what to do with it?Edit: It seems to be even faster then the HR change, so a drop in ZS is predicting a HR rising. Could be of use somehow
-
@VoiGAS I think you’re looking for a prediction where there isn’t one. ZS is a result, not a predictor. From what I understand, it measures fatigue as it happens, so it can’t measure it in advance. At the start of a hill, I’m not tired, so ZS shows aerobic, but during the climb, it shows when I’m starting to feel the fatigue. It essentially reflects the RPE, but it doesn’t predict anything. I’ve also noticed there’s no consistent link between heart rate and the ZS algorithm. I live in a very hot region, and my heart rate can be moderate when I run under the sun, but the algorithm immediately switch me to anaerobic or even vo2. Additionally, it all depends on whether I’m fatigued or not; my lactate threshold is calculated completely differently. Yesterday, my lactate threshold was 191, and the day before it was 174. I slept better and less stress… Another clear example is that the algorithm continues to function during descents, even when the heart rate is very low it can be high anaerobic for ZS. I’ve stopped training by monitoring heart rate or pace and now only focus on the ZoneSense values linked to RPE. I use power for short intervals.
-
@iterumtenta I didn’t mean prediction like talking about the future (sorry, no nati e speaker here). More like “faster than HR change”, because thats what it looks like in the graphs if you look in detail
-
@VoiGAS I don’t think it can be faster than HR since they have different causes and effects. A higher HR leads to fatigue, but fatigue can be caused by various factors, and ZS will only reflect that after some time. When you start running fast, HR increases immediately, but fatigue sets in a bit later. If the fast run is too short, no fatigue… just like ZS. In my view, ZS teaches RPE.
-
Although I’m not an athlete, I’m still interested in ZS as I see it as a very interesting approach to monitoring daily exercise.
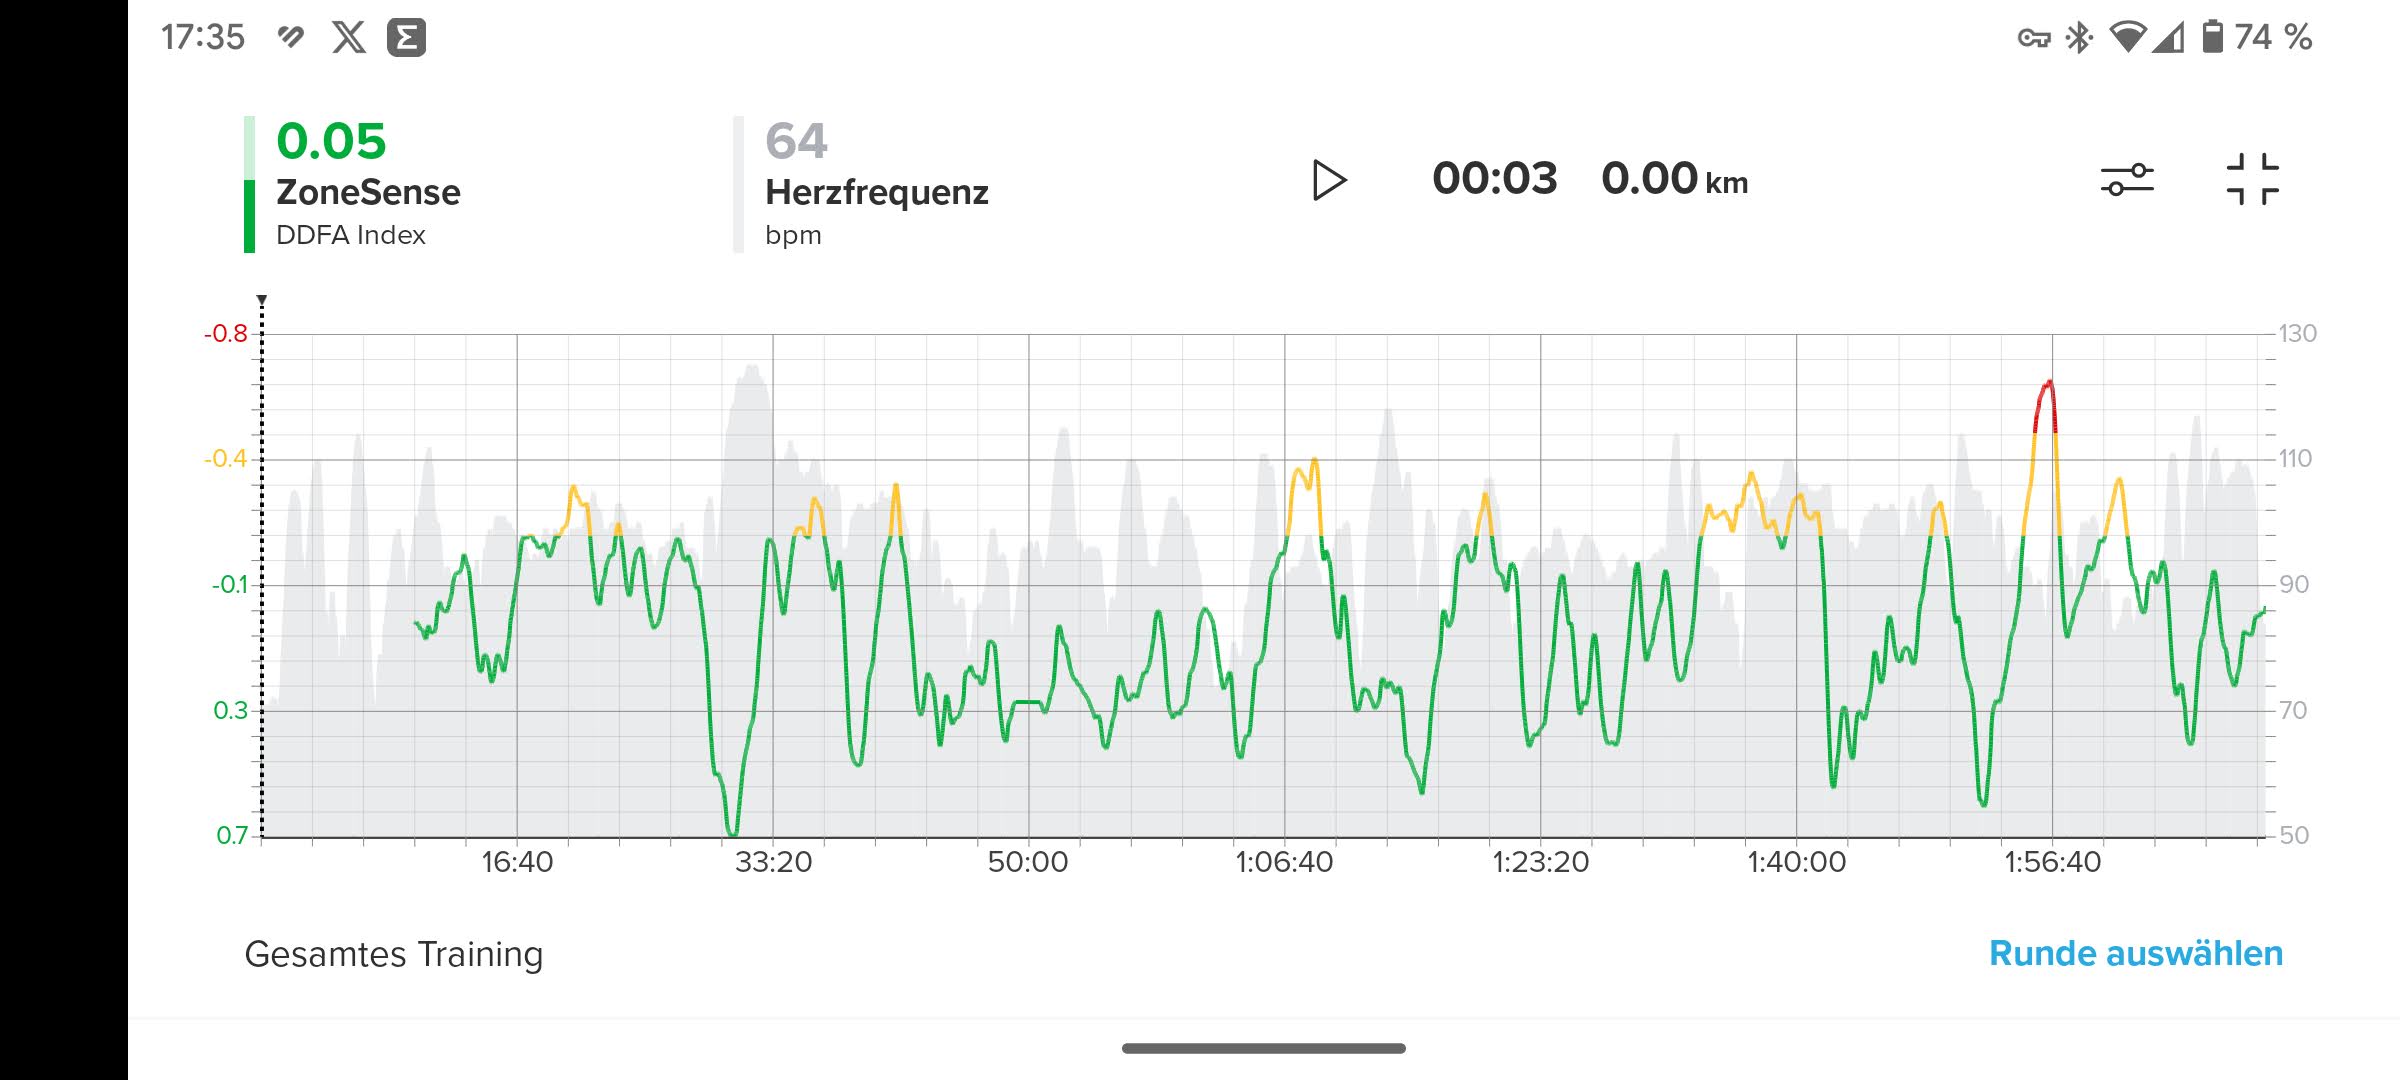
In my experience, when I’m out kayaking or kick biking, these are more intense sessions and I make sure I’m in recovery mode the next day. ZS should be good for that.
Today after lunch (the visitor for the afternoon had announced himself a little earlier) I went out for a short ride on my bike in recovery mode after the workout yesterday. Even on the first few meters, I could feel that my stomach was still very full from lunch and that I was full to the brim.
Nevertheless, I managed a good 40 km at a moderate pace, even though it felt very strenuous. Yesterday my aerobic threshold was 123, today I felt tired well below that and it was somehow exhausting (although my HRV at night was 10 points above average).
And to my astonishment, I could see this very clearly on the ZS live display. Without much effort, it quickly went into the anaerobic range and even into the VO2max range at the end of the climb, although my pulse was rather ridiculous today and my maximum heart rate was 125 bpm.
Either it was a coincidence or ZS actually recognizes the bad days like today and shows it on the watch.

-
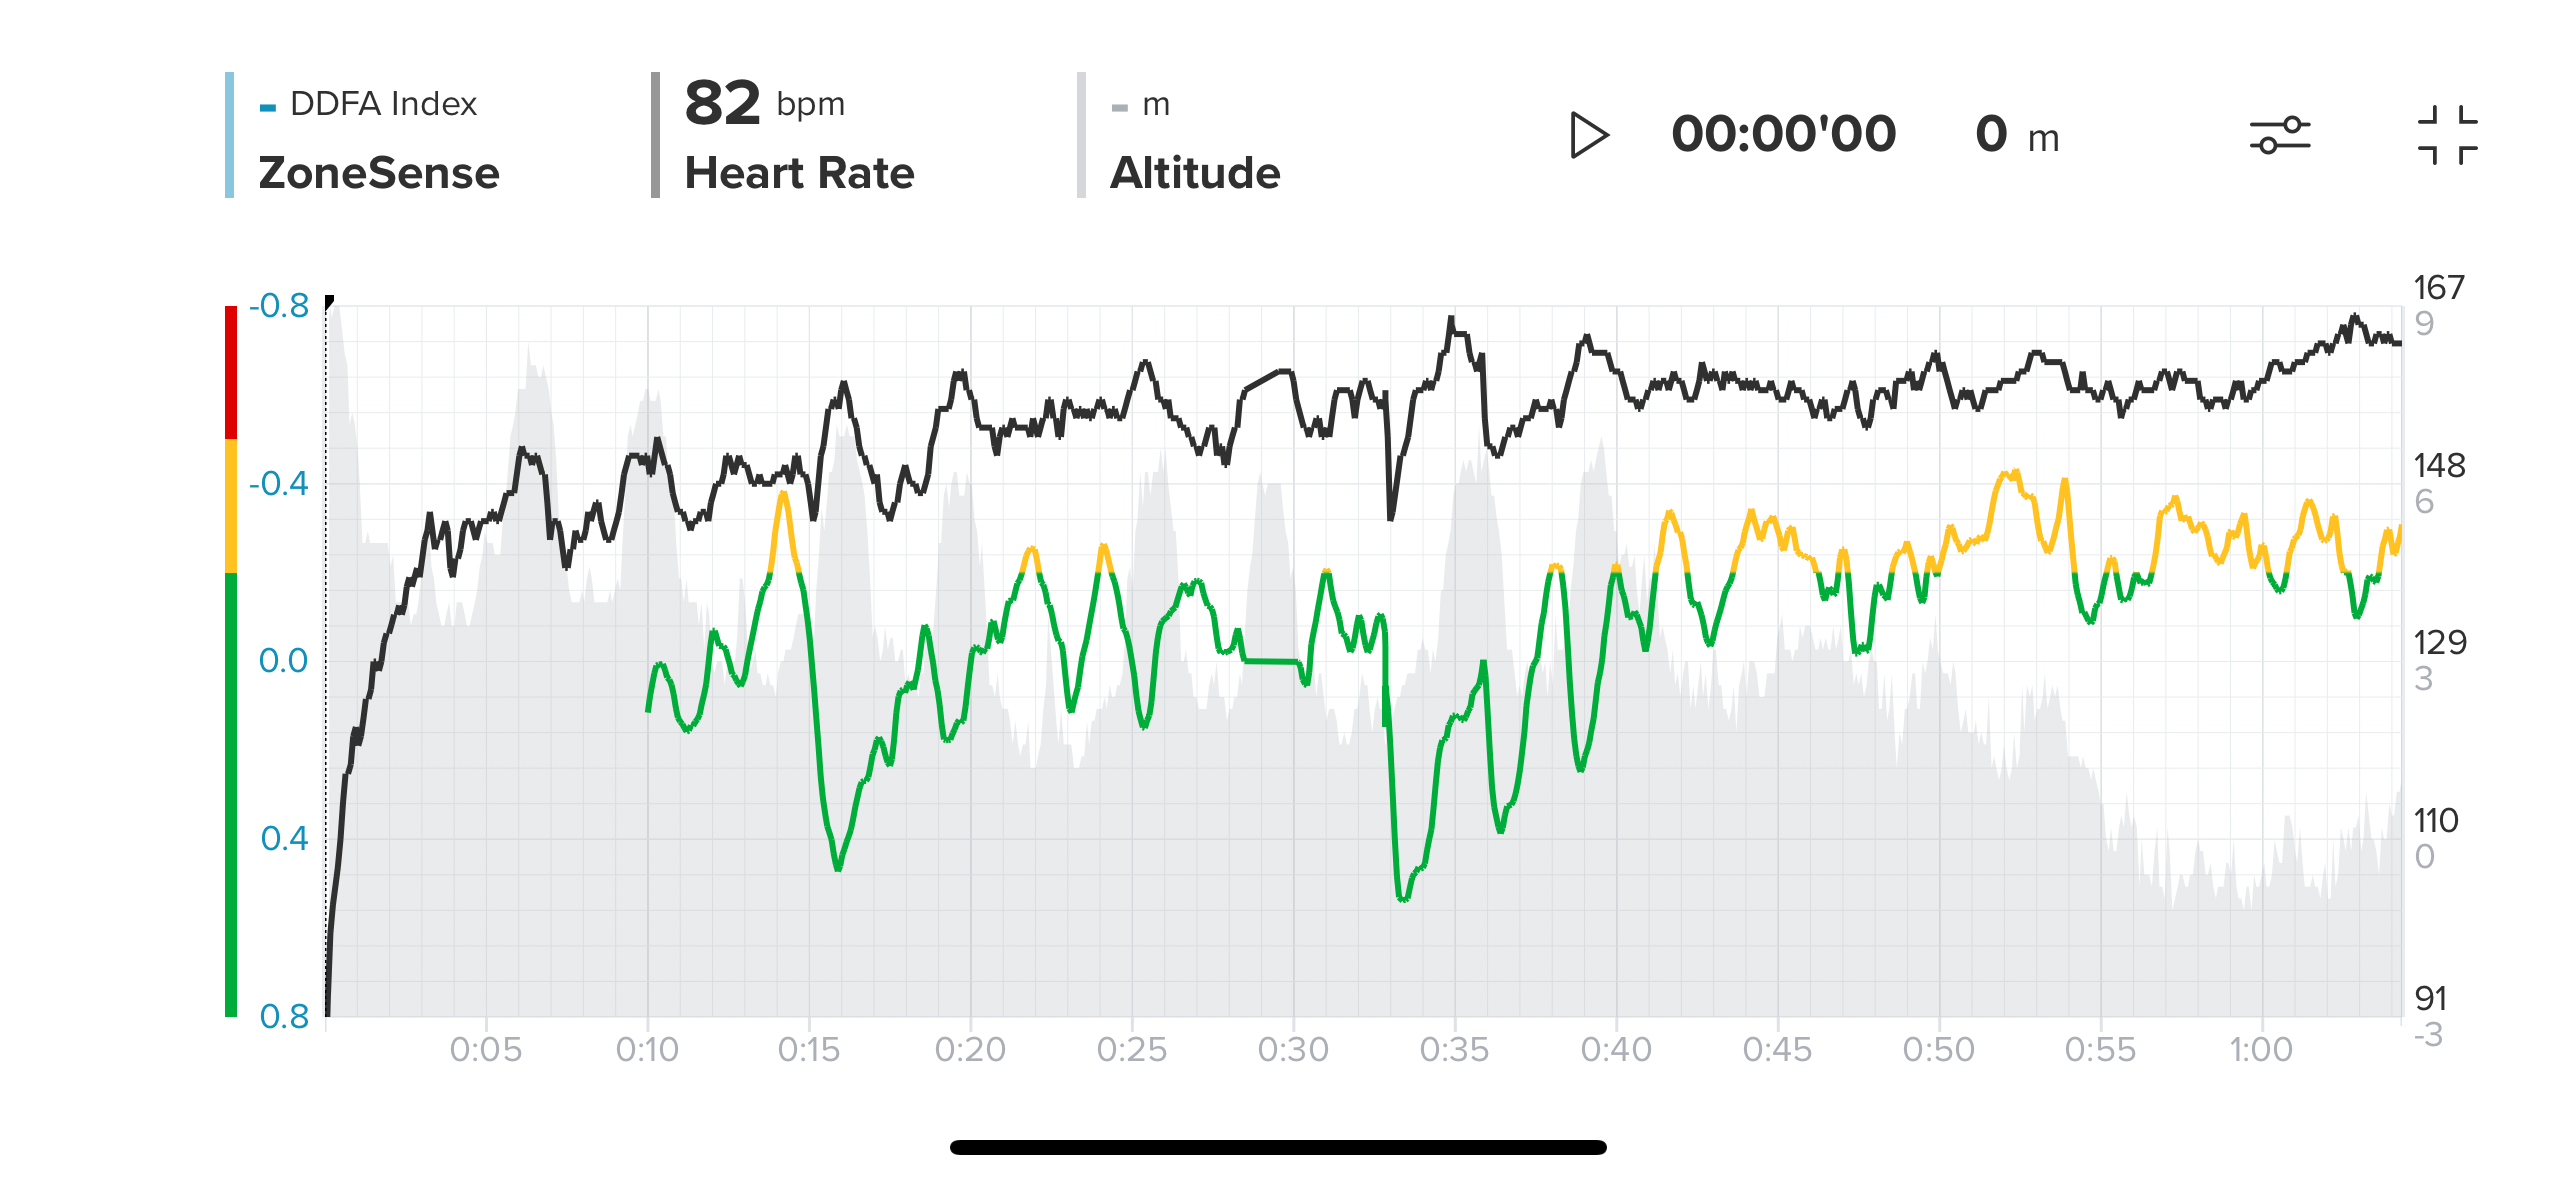
Today, I went for a run on a nearly flat surface. The yellow section corresponds to a very sunny part of the run. Clearly, the algorithm doesn’t directly correlate with heart rate, pace, or power. It factors in a combination of things like fitness level, physical condition, fatigue, weather, sleep, recovery, nutrition, health, temperature, elevation changes, stress, and more.
-
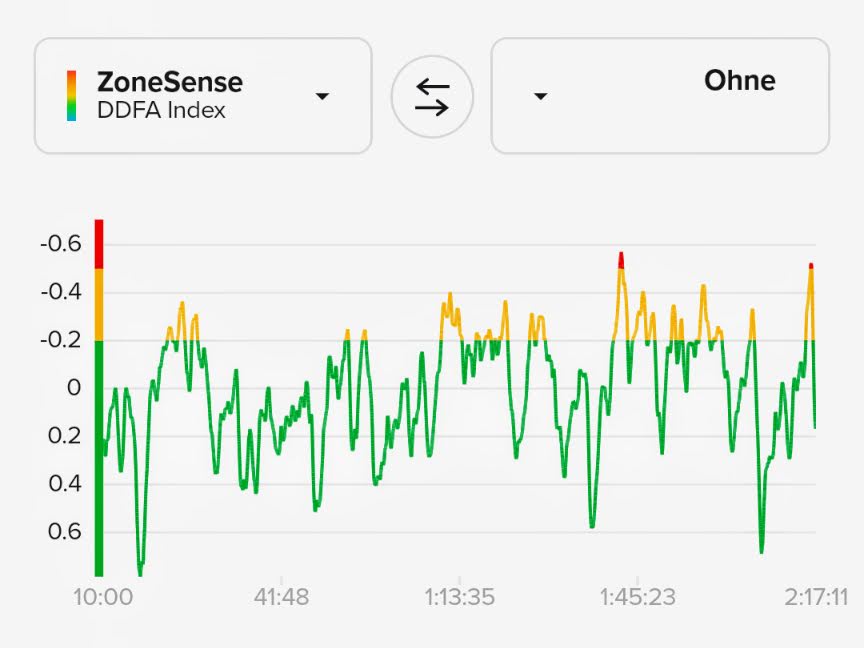
After a few rides on the bike with different loads, I’m starting to know how to react to the changes (next higher zone reached, next lower zone reached) in the live display in order to stay reasonably constant in the target zone. The delay of ZS gives me the option of immediately reducing the intensity slightly when reaching the next zone if it’s going up or increasing the intensity slightly if it’s going down.
On the bike, it’s as simple as shifting down or up a gear to reduce or increase the intensity at approximately the same speed. It’s a nice thing and a considerable relief to actually stay in the target zone without being fixated on heart rate or speed.

It looked pretty good today, I didn’t quite get the headwind and a slight, barely noticeable incline right yet (towards the end of the activity, the last spike is a uphill of 45 m to my house).
-
@pilleus, great insight. Appreciate it!
-
Quick question on ZS, my usual trail run is 1h-1h30 almost daily, I start my run from home or school after dropping my children’s
I have elevation in the beginning of the run, not a lot and I usually walk as soon as grade is above 7-8% to keep my Hr below 150 (my threshold is 172 and max hr is 202 I m 42 years old )
My question is the following, as I start my run with climbs and Zs use the 10first min to create the baseline of my day could this influence Zs ?
I have the feeling the Zs is a bit « optimistic » on my aptitude and sometimes I found I should be in yellow and it show me I’m in green
So maybe as my run start with hard part and after it s almost flat it could impact the detection ? -
A tiny-tiny bug that I’ve found.
When using Aerobic Decoupling and ZoneSense with ZoneSense displayed, an event (alert) from Aerobic Decoupling resets ZoneSense view to a default that contains time in each zone. So when a different value were cycled by the top button, it’s back to default view.
-
@Josaiplu It’s definitely possible that starting with a climb could affect your ZS reading. Since ZS uses the first 10 minutes to establish a baseline, hitting an incline right away might cause your HR to spike, making ZS think you’re more recovered than you actually are, especially if the rest of your run is easier. That could explain why it shows green when you feel it should be yellow. Just my take though, others might have more insight on this…
-
@duffman19 said in Suunto ZoneSense:
My main issue is the one pointed out by others above: As soon as I shift into a higher intensity, like the start of a steep uphill, ZS takes a nosedive and never catches up. You can see this on lots of the shared graphs. I thought this might be explained by the 3-minute data window, but that would only be relevant if my effort leading into the climb was extremely low, which it usually isn’t. I haven’t read a good explanation for why this happens. This is why I suggested a smoother algo to make the dips and peaks less severe.
I use Vertical with polar H10 and I have the same question.
How is it possible to be in the green zone during a steep uphill during 10 min / 150m ascend for exemple when my RPE and HR tell me that I am pushing hard ?
My exemple is after 50 min of trail, during the uphill first it’s low in the green zone then just before the top I reached the low yellow zone. -
@Kramble @duffman19
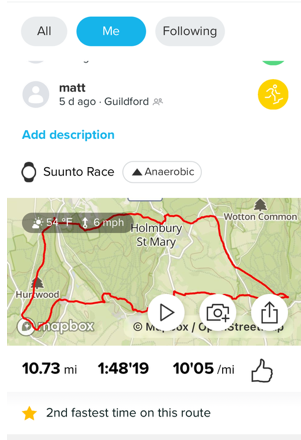
I have been seeing the exact same thing up until yesterday (ZS dropping into low aerobic as I start climbing & increasing effort, basically reverse of what I’d expect to see).This was my first time out since ZS updated on Friday & it worked perfectly (ignore the 2 drops at around 1hr.12mins, I was skiving off work & had to take 2 phone calls whilst on the trail)
So from what I saw yesterday the update has worked has worked a treat.
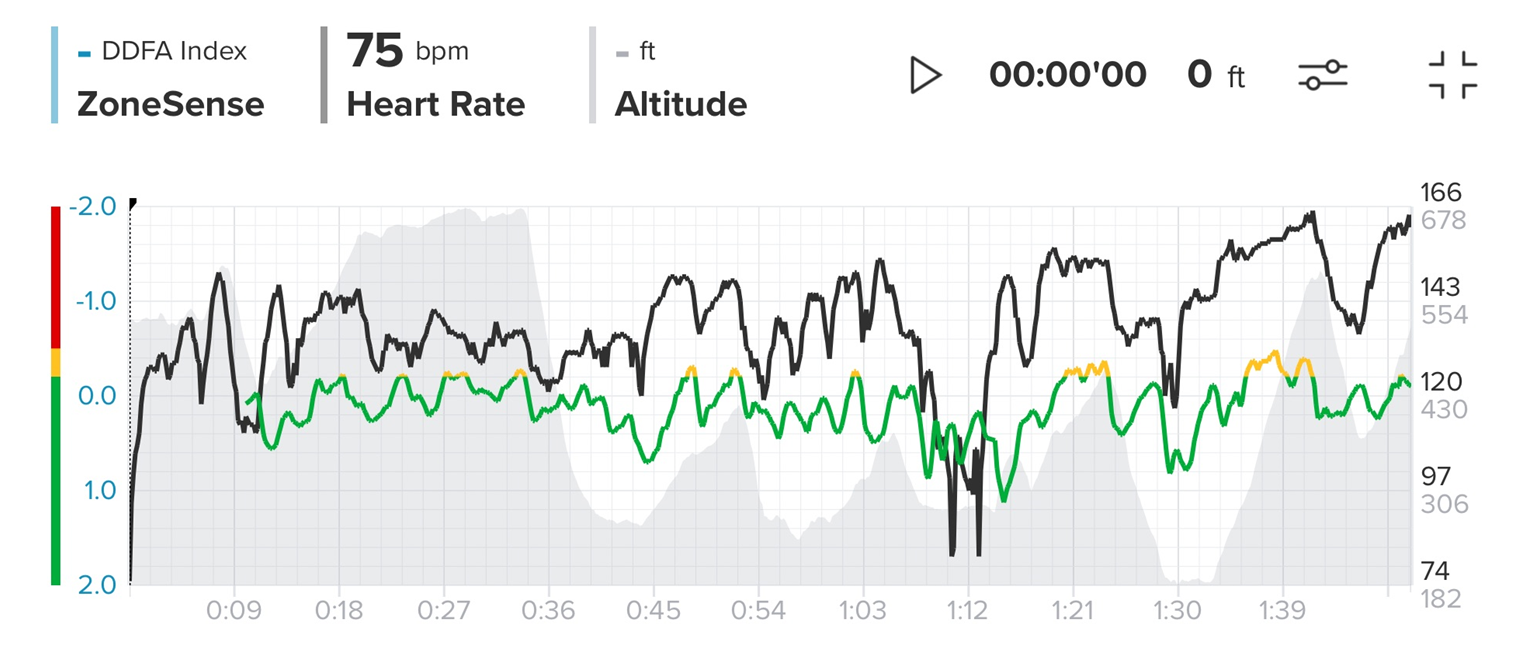
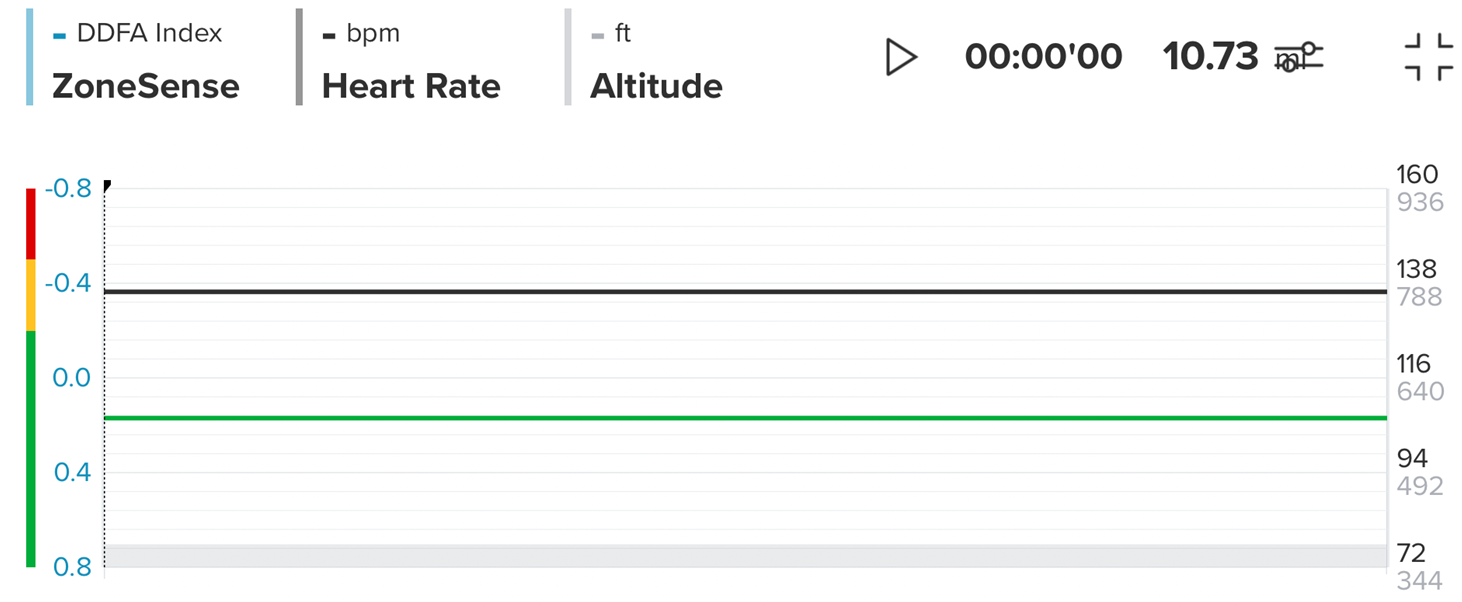
Incidentally I uploaded a run on Friday around the time ZS updated & it totally screwed the results…
-
@Mattg576 said in Suunto ZoneSense:
@Kramble @duffman19
I have been seeing the exact same thing up until yesterday (ZS dropping into low aerobic as I start climbing & increasing effort, basically reverse of what I’d expect to see).This was my first time out since ZS updated on Friday & it worked perfectly (ignore the 2 drops at around 1hr.12mins, I was skiving off work & had to take 2 phone calls whilst on the trail)
So from what I saw yesterday the update has worked has worked a treat.

Wow never seen such coherent graph !
I thought I did the update, hard to be sure… -
@Kramble you can remove it and reinstall to be sure.
-
@iterumtenta said in Suunto ZoneSense:
@Kramble you can remove it and reinstall to be sure.
Thanks, but I already did, is there a way to check it ?
-
@Kramble Since the release is the updated version, reinstalling should work fine. I couldn’t find a way to check the exact version installed on the watch either.
-
@Łukasz-Szmigiel said in Suunto ZoneSense:
A tiny-tiny bug that I’ve found.
When using Aerobic Decoupling and ZoneSense with ZoneSense displayed, an event (alert) from Aerobic Decoupling resets ZoneSense view to a default that contains time in each zone. So when a different value were cycled by the top button, it’s back to default view.
This bug applies for all alerts unfortunately