Training readiness would be great for an upcoming update !
-
@d-v Excellent suggestion
 If the watch and app can measure your Traing Load (TL) for a period of 2 to 4 weeks, along with sleep, and HRV a better level of readiness can be engaged for an upcoming training event.
 -
Looking again at Garmin’s page, let’s see what we can do to invent our own feature, for those who want a number. Again, the page I’m using is this:
On that page these’s six criteria listed, but two of them are both related to sleep, one factor is last night, the other history. One factor, Recovery Time, currently does not have a quick way to check with Suunto – one can look at individual sessions, but not have an aggregate total. Here’s the list, in my own ordering:
Sleep (Last Night)
Sleep (History)
Stress History (Resources)
HRV Status
Acute Load
Recovery TimeI’m also going to add on Overnight Heart Rate (average/min) as a category. Now let’s give all these factors a “weight,” that is, how much they can contribute to a total score of 100. Note all the following is just me making stuff up; please, no wagering.
Sleep (Last night) 30%
Sleep (History) 20%
Resources 20%
Overnight HRV 20%
Overnight Heart Rate 10%This gives a total of 100% – I decide for the Acute Load and Recovery Time, i would make those “only negative,” that is, if your Recovery Time is zero, that doesn’t help this status, but having a recovery debt detracts from the rest. So add the first five, get a total, then decide if you need to subtract to lower the score.
So in my picture from before, I’d score self like this:
Sleep Last Night 20 of 30 (a little low)
Sleep History 20 of 20 (last week fine)
Resources 15 of 20 (73%)
Overnight HRV 20 of 20 (right in range)
Overnight Heart Rate 8 of 10 (could be lower)This adds up to a score of 83, currently in the High range. Looking for negatives in recovery and ATL, neither was a factor.
And 83 fits roughly in how I felt. I could handle most of my normal activities. Note this isn’t too far off my Resources score of 73 though, so maybe just use that.
Now this still does not take into account muscle fatigue, mental state, outdoor weather, or other things that might influence what I do.
-
@James-Eastwood please read that line again. I didn’t say ZoneSense is the same with any word…
")
-
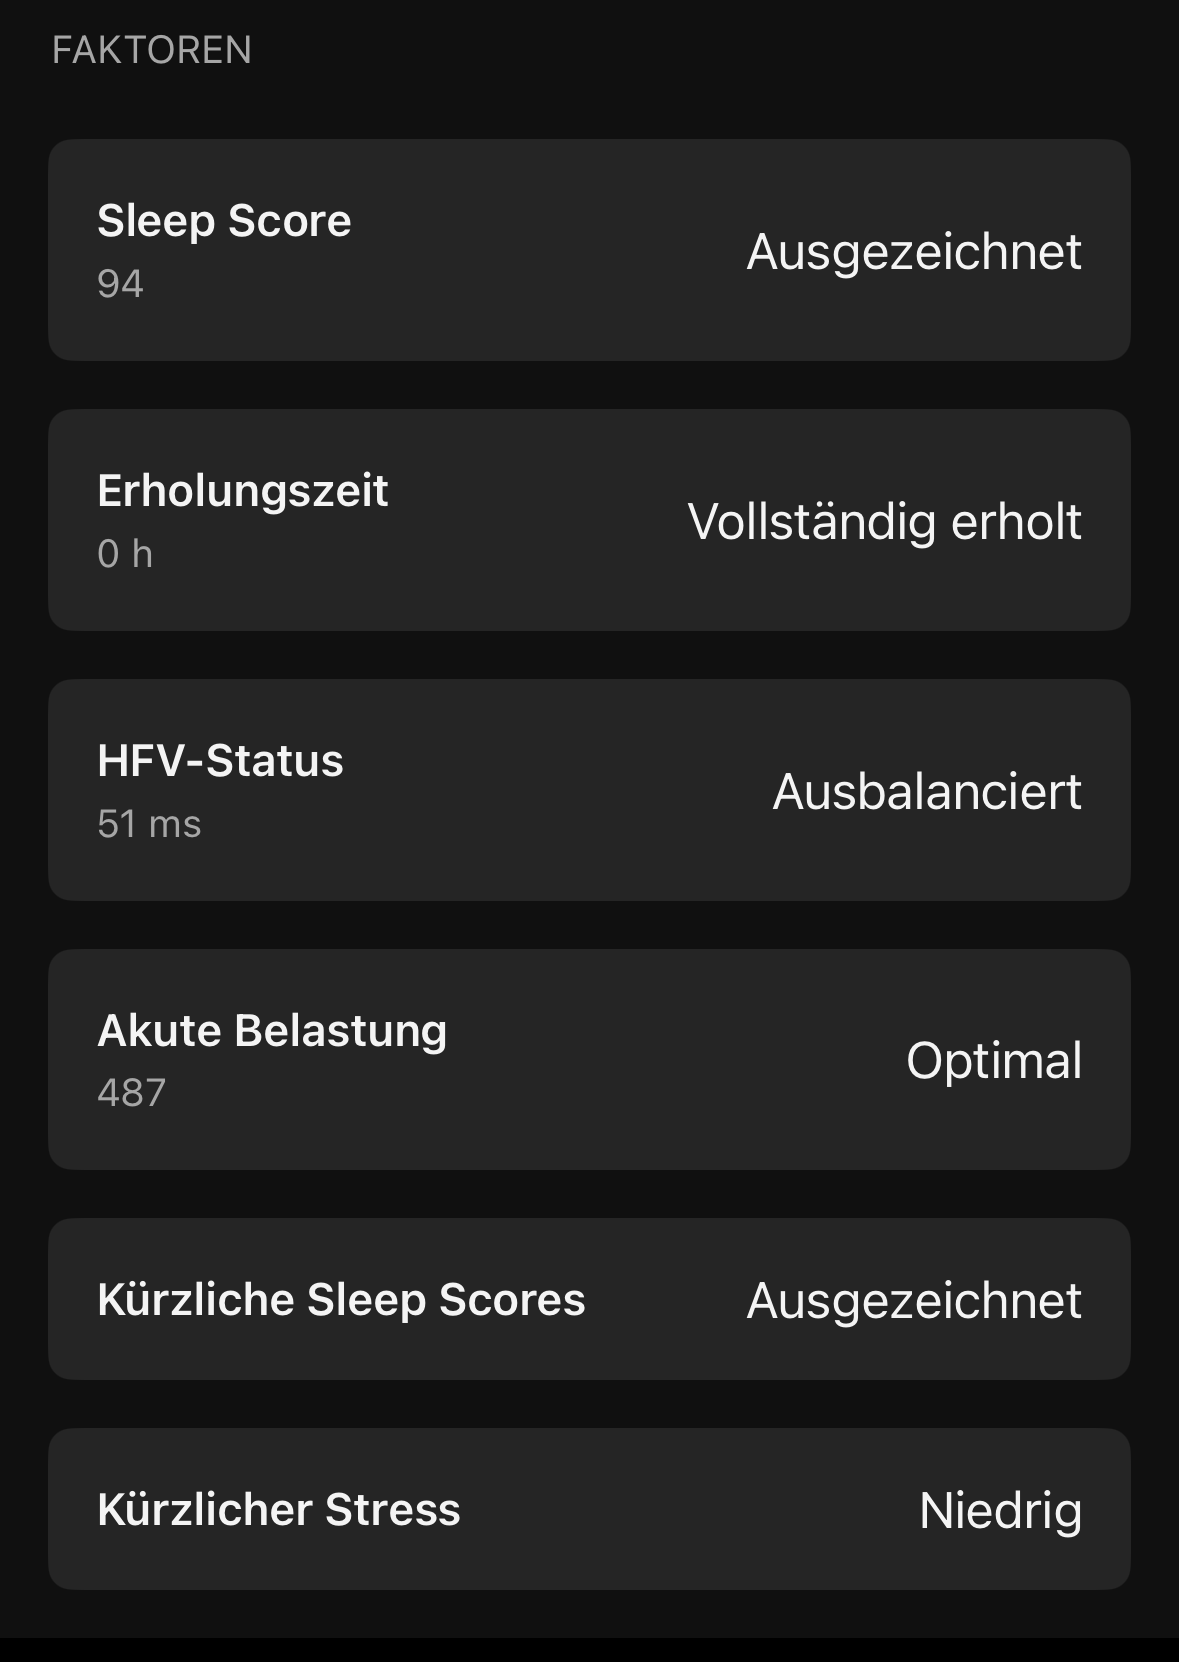
@raven said in Training readiness would be great for an upcoming update !:
If Garmin were to “break out” the score – showing a “88 / High” score as the result of adding X from sleep, Y from predicted recovery time, Z from HRV, Q from acute training load, etc. then can better determine if they need to make a modifier.
Actually they do so:
-
As a first pass that seems pretty reasonable to me!
-
@2b2bff Ah, interesting! I was just looking at the watch pictures on their page.
-
Maybe

-
@raven you als have this on the watch in the training readiness widget…
-
@2b2bff said in Training readiness would be great for an upcoming update !:
@raven you also have this on the watch in the training readiness widget…
Again, good to know. My info just came from the Garmin page I linked above, more specifically, this photo:
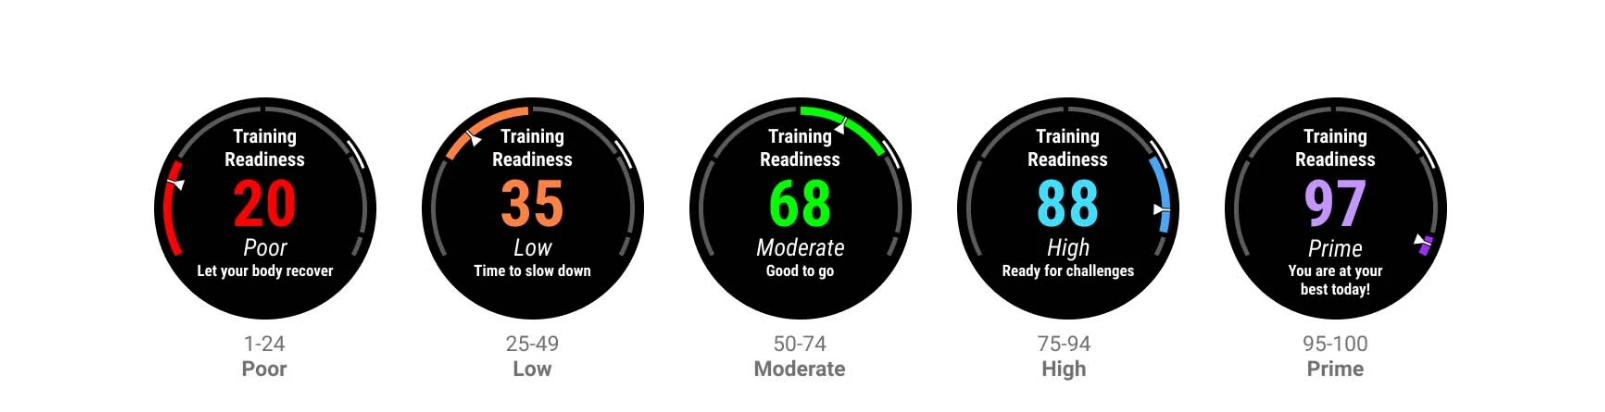
As I noted, I particular find it difficult to understand the difference between the Green and Blue distinctions here. I’d need to see more specific examples of one day in the green and one day in the blue, with the contribution breakdowns, and then perhaps I’d be more on board. As someone who recently was debating between Suunto, Garmin, Coros, and Polar, I find it odd this feature is not on the lower end models where I think it would be more appreciated, other than to try to encourage people new to fitness to spend a little bit more to get it.
Anyway, this is just to summarize at the moment I’m not a fan of a 1-100 score with five colored stages, and perhaps a three stage system of basically Stop, Warning, Go seems better, which Suunto does have on the HRV feature.
https://us.suunto.com/blogs/blog/how-to-use-hrv-to-optimize-your-recovery
For those who want something like the Garmin, they could cobble together a system like I quickly did above. The harder part is an initial investment on how one wants to weigh things, but after that, day to say I think it would be quick to look at the widgets on the home page and assign some numerical score to it as one wishes.
Sounds like Suunto is doing something in thie area so will be curious to see what they come up with.
-
The hrv example is a good one, as it shows Suunto is already on board with this approach. The suggestion is basically just to show the same thing, but taking more of the available data in to account.
I wouldn’t mind if there wasn’t a number at all, and it was just an arrow pointing at a colour on the spectrum. Numbers are useful for longer term pattern analysis though, like for example in intervals.icu.
-
@James-Eastwood For me the difference is the HRV number is a measurement with a known way of determination. With the Garmin number, while the factors are listed, as far as I know the math to get the final number is not really shown. Additionally, I think I find some friction when also considering Suunto’s Resources metric (Garmin’s Body Battery) that’s also a 100 point scale in both cases. Can there be times one has low body battery / resources but high readiness, or vice versa, and if/when that happens, what does that mean?
-
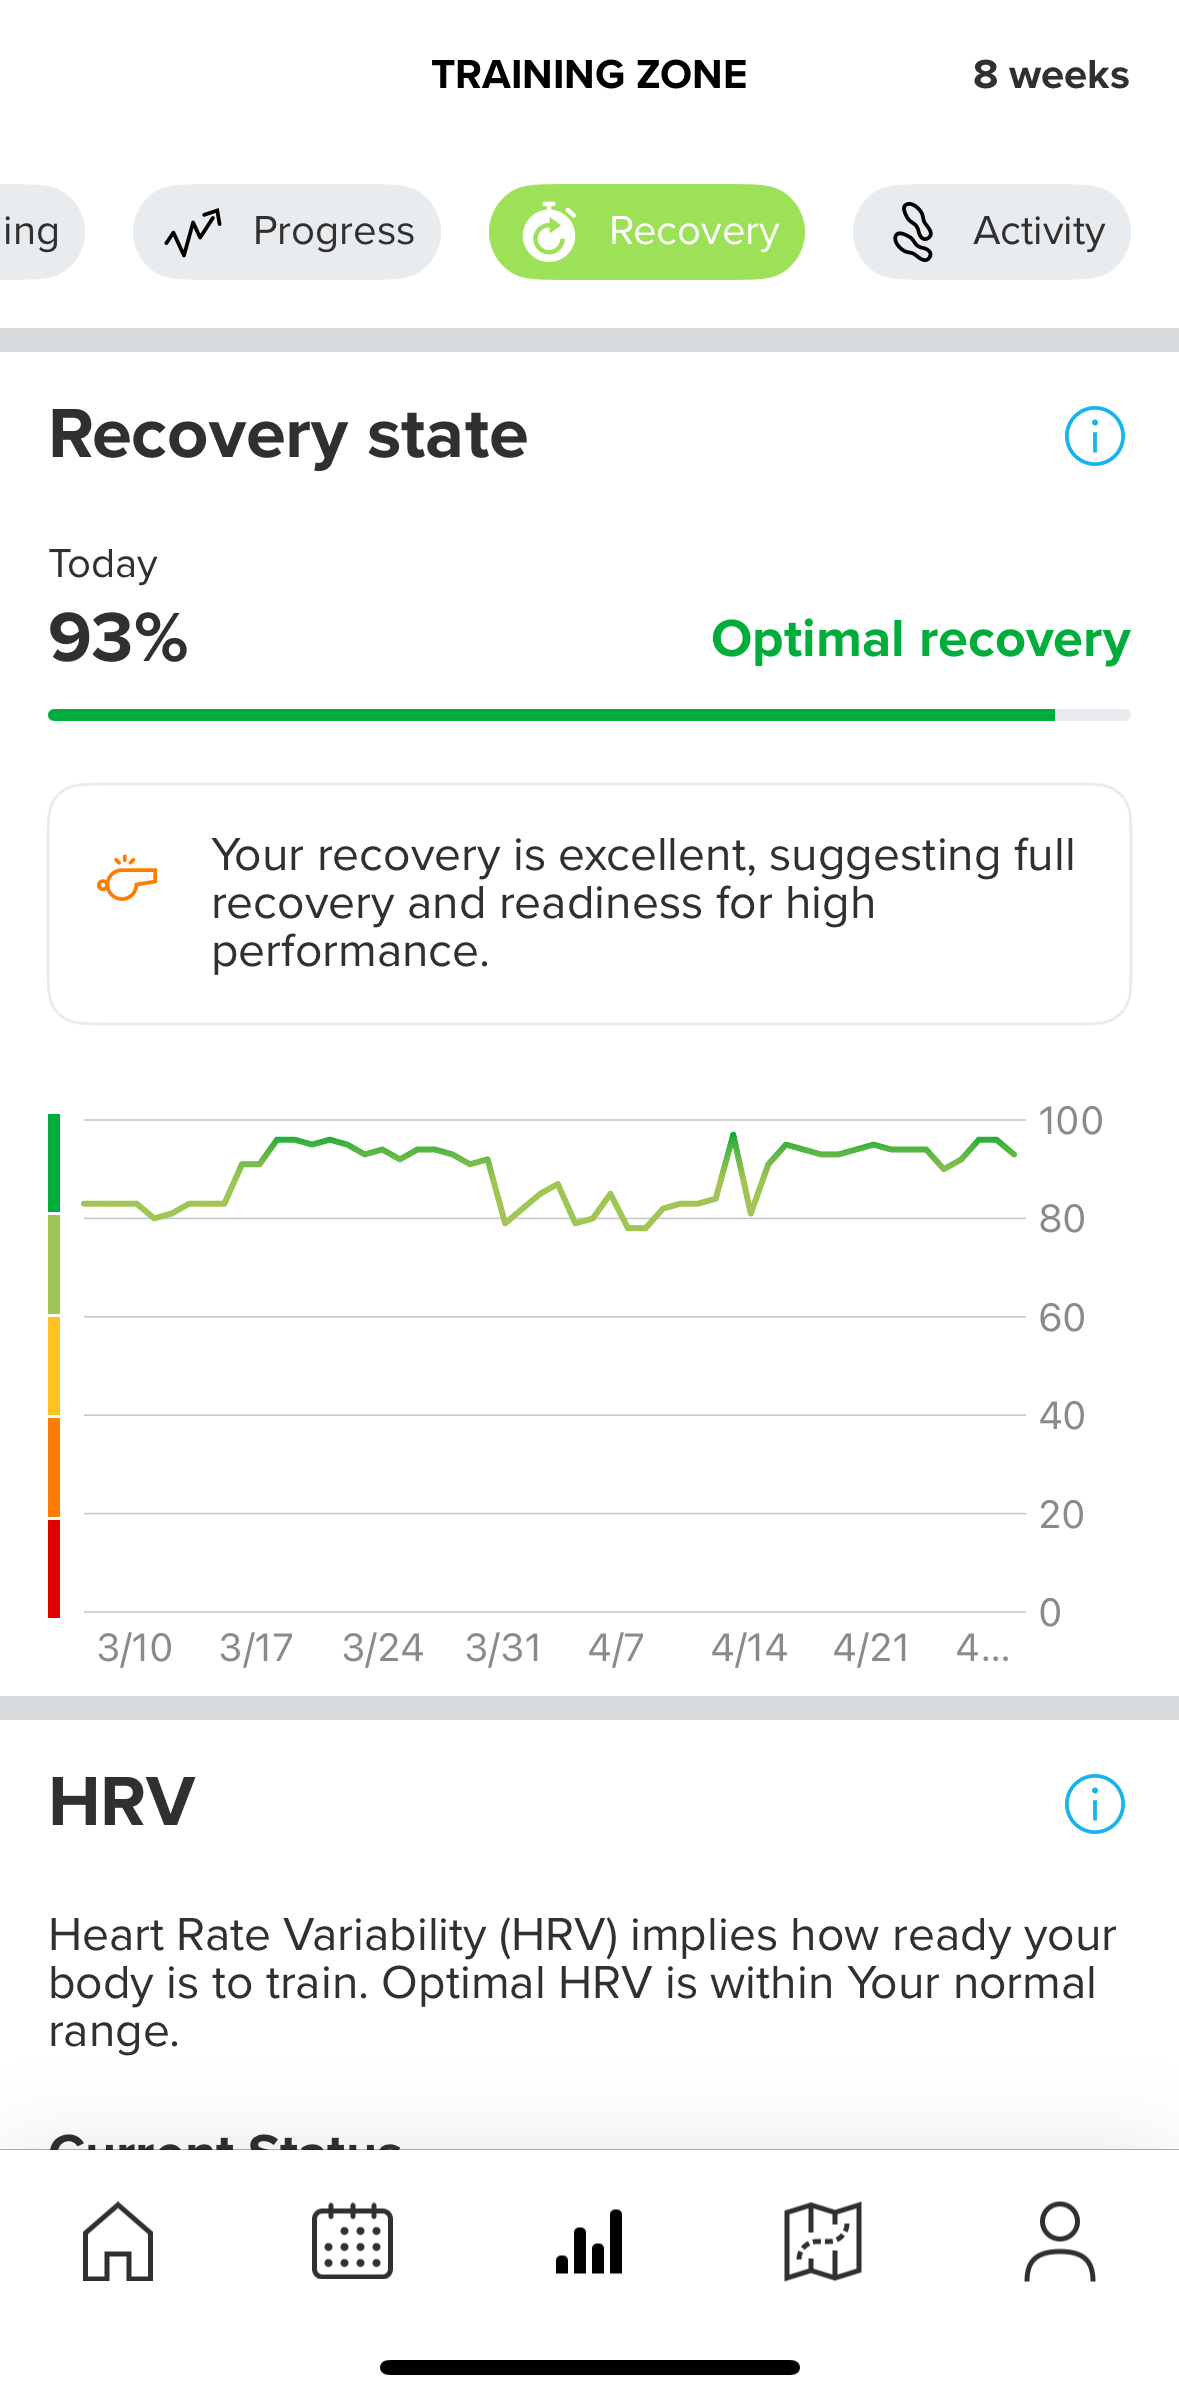
In latest iOS beta there is Recovery state chart under Recovery tab. It is impacted by training load, sleep data including HRV and daily activity such as stress tracking. Recovery state is a measure how well body is recovered and ready for sport activities. Looks great. I guess it could also be used as base for training adaptive plans in the future.

App: beta
Phone: Iphone
iOS -
@dulko79 should also come to Android in next release
-
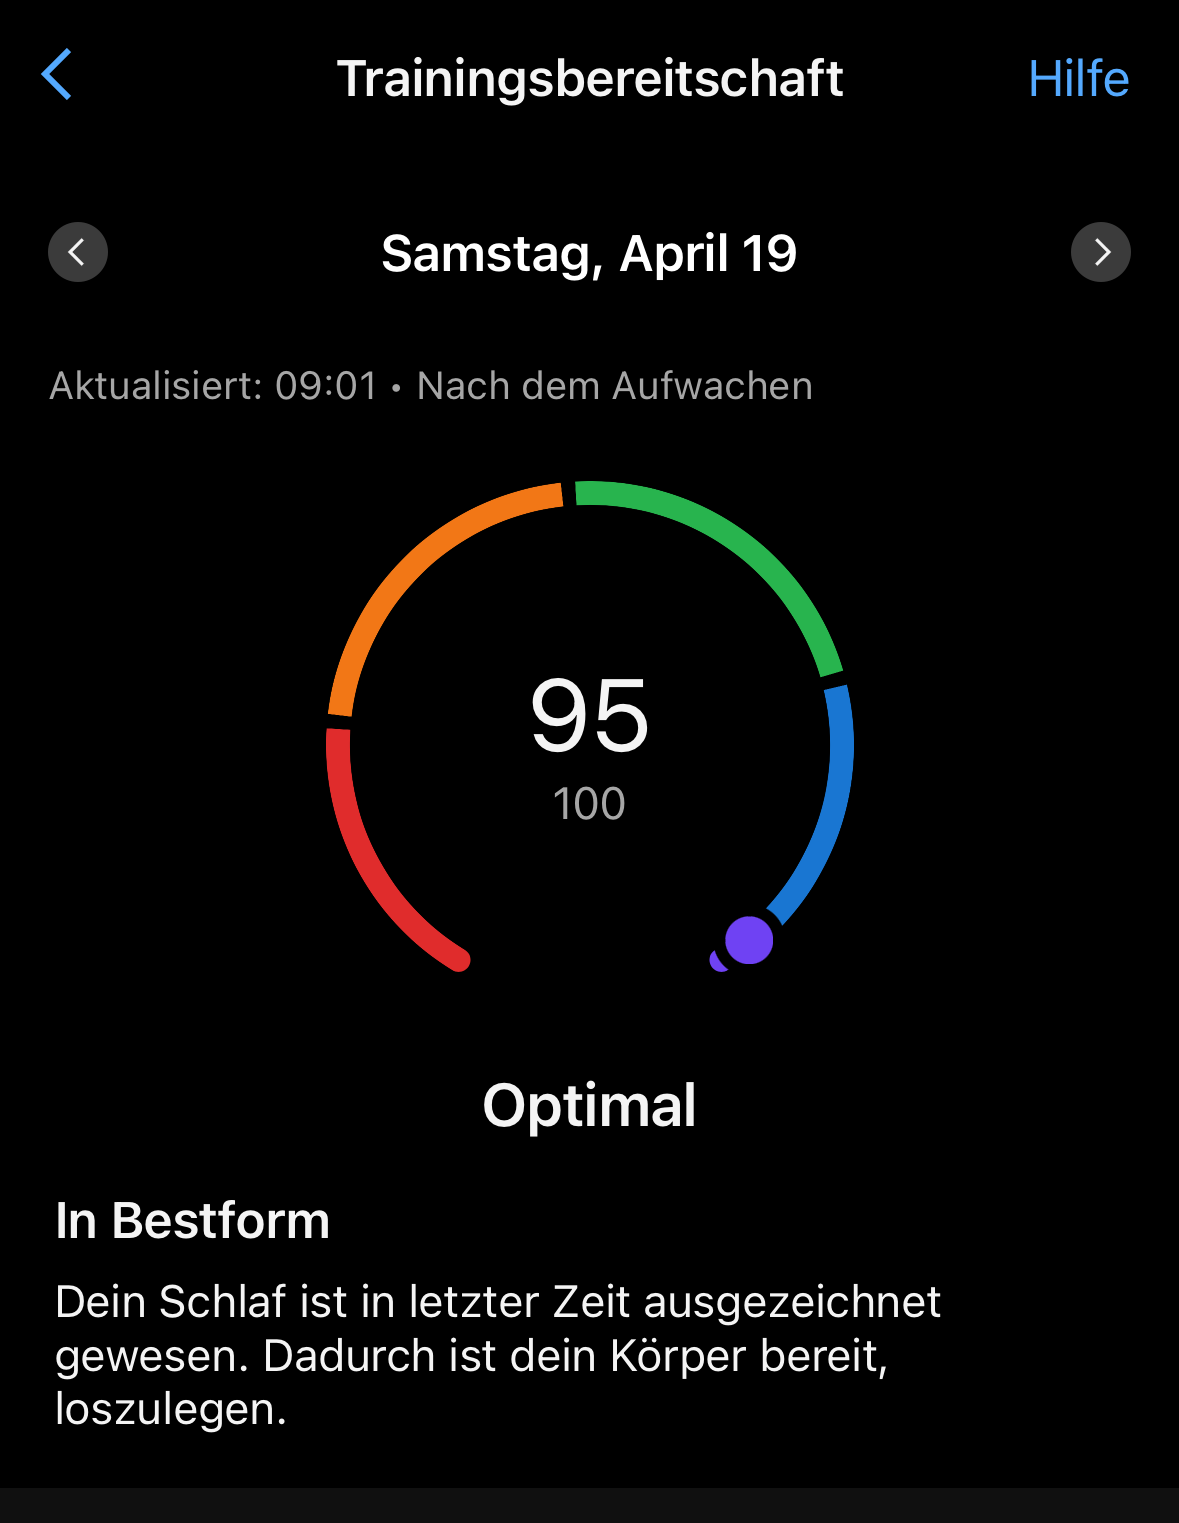
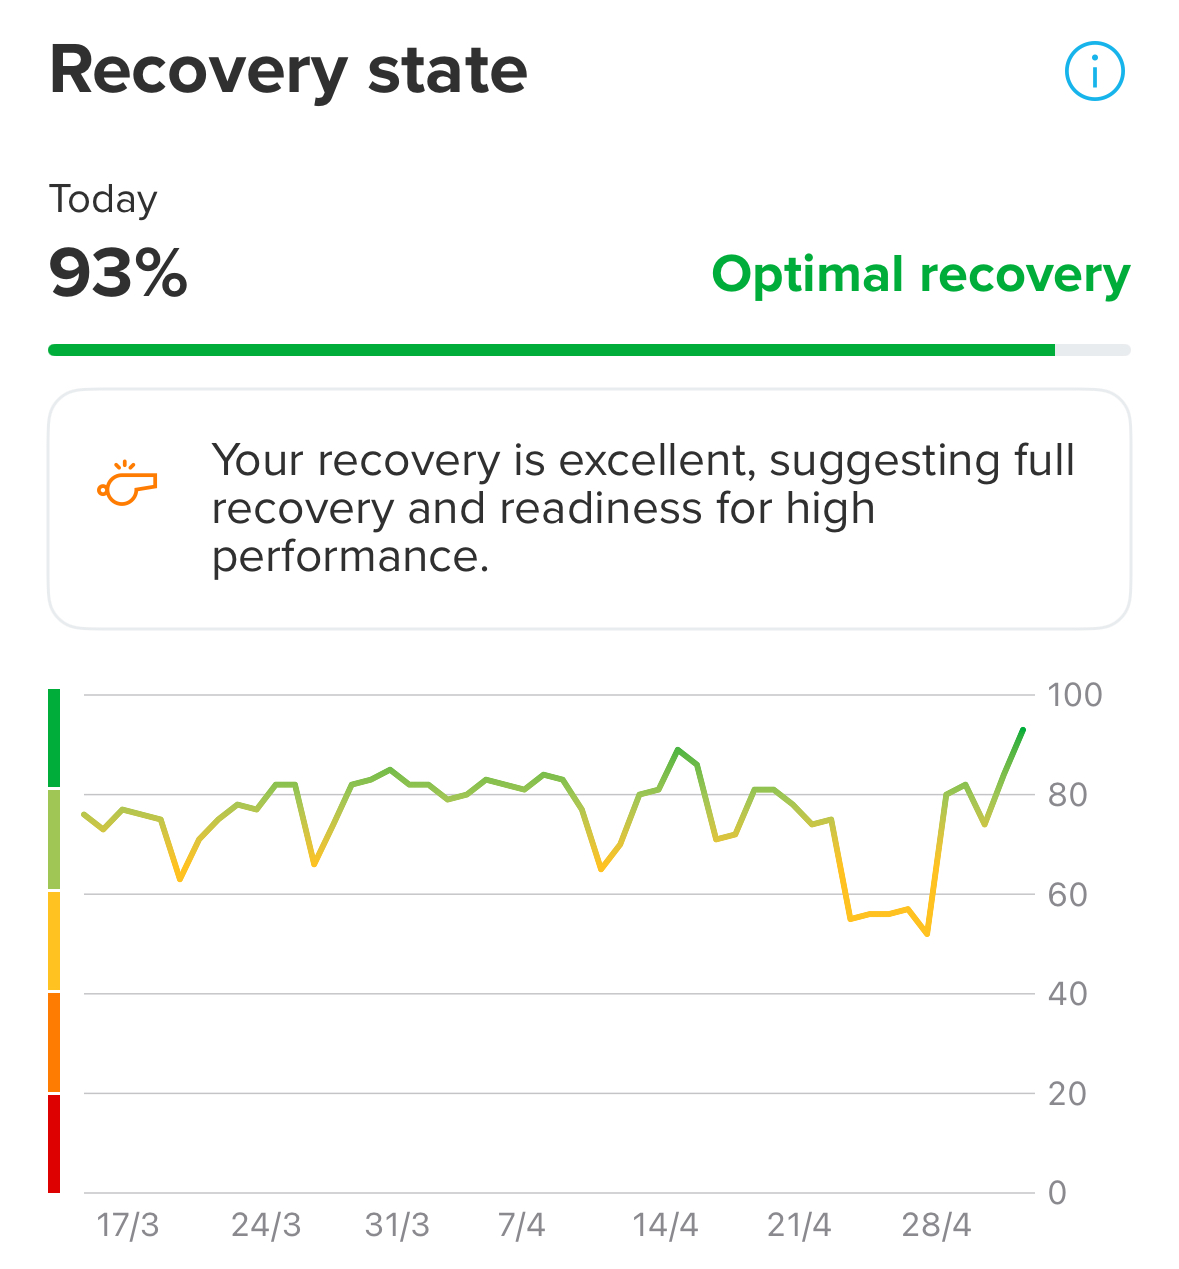
The new Recovery feature is in the App Store for iOS — beta not required. Here’s how it looks:
Note at the time I took this screenshot, at the same time my Resources read as 34% (I had run 11km earlier in the day), but also says I had 78% wake up resources.
I interpret this as Recovery is telling my “best state” as I first wake up, and does not update throughout the day. This is fine but not completely clear in the info shown. If I wanted to do an additional workout now, I would not trust the “93%” showing on Recovery. Instead, I’d look to either the 34% Resources or my 86 CTL / 95 ATL / -2 Form, which means right now tomorrow will be at -9 Form. I could do a little bit more but not another 10km run, despite 93% Recovery still showing.
Clicking the info on the top right of the Recovery area gives this information
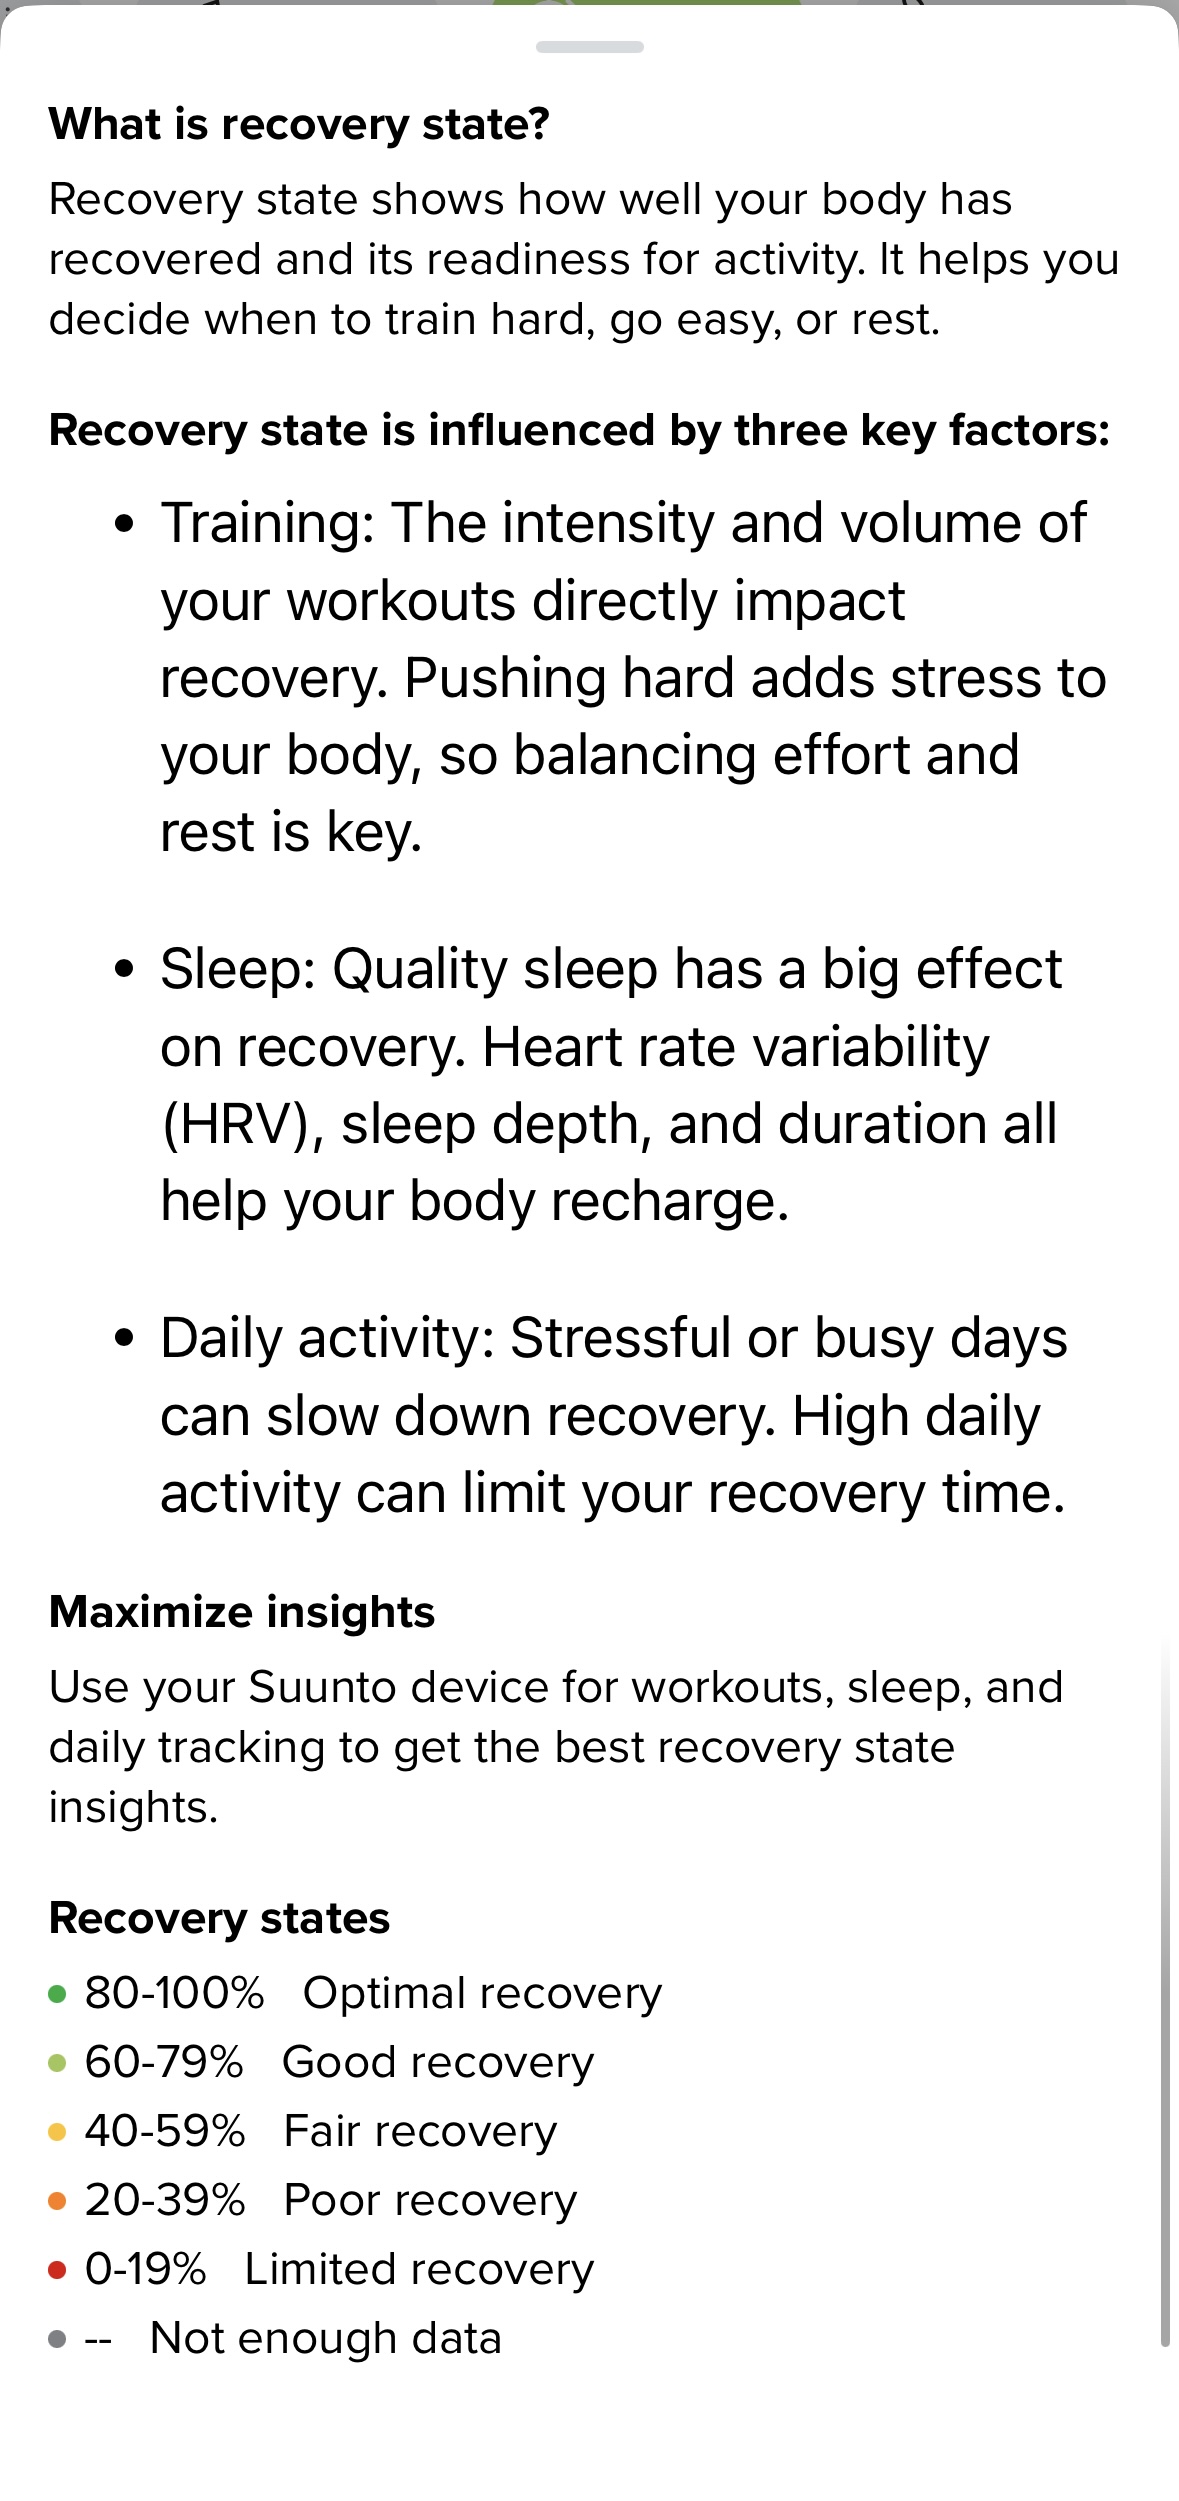
I’m not sure what’s up with the different fonts used there. A bit weird.
There’s no way to “open” the graph and get discrete information on other days, that I can see, which is a limitation I also have in other areas, like the daily heart rate graph. Additionally, there’s no “widget shortcut” to put on the home page, although one can select the HRV widget to quickly get to that area.
As an aside, I find the Training Zone tab overloaded, with Overview / Summary / Training / Progess / Recovery / Activity areas all bundled together. I think this is due to having five tabs on the bottom: Home, Calendar, Training Zone, Maps, and Settings/Profile.
I’d remove the Profile tab, and instead on the Home page put an icon on top to get Settings/Profile (where on the left is the Watch icon, and on the right is a + with some menu items and notifications. Put a Gear symbol up there on the right, and now you’re down to four tabs, and can split Training Zone up a little bit.
When I select the heart rate widget on the Home page, I get a “Today” screen, that starts with a summary of distance / time / calories, then an activity log for the day, sleep data, resources, heart rate graph and stops and calorie graphs. This Today screen isn’t in the Calendar tab though, and the Activity bubble in Training Zone also gives steps/calories but in a scrolling view showing multiple days. If one wants to go from “daily view” of calories/steps to the scrolling view, it’s two different areas.
There’s a lot of good info in Suunto app, and it’s not horribly organized but there are areas of improvement that could be done.
-
First actual morning with the new Training feature and I’m minorly surprised.
I scored 93% again, “optimal recovery” which is good of course. However, my overnight heart rate only got to a minimum 54bpm. Previous three nights were 48bpm, 49bpm, and 47bpm. My internal model is that not going below 50bpm is a bit of a warning. My average HR was 58bpm, previous three nights were all 52bpm average.
Note that my wake-up Resources today was 65%, which is classified High, but for me a bit lower than usual. The previous three days were 81%, 82%, and 85%, respectively. This seems more in line with what I’d expect.
Minimum heart rate is not listed as a direct factor for the Recovery score which likely explains the discrepancy.
HRV is though, and that was fine 45ms in my range of 41-48, and Sleep was in normal range. My Form today is -9 also in a typical range for me.
I also wear an Apple Watch and one metric I get from that is my respiratory rate, which is slightly elevated at 16.5 br/min, typical range 14-16.3.
Overall, I don’t think this is a major problem, given Suunto is warning me by the slightly lower Resources and showing my the overnight HR data (but now curious why it doesn’t do respiratory rate as well) but 93% is a bit too optimistic. I would have guessed 80-85% perhaps.
Unless the metric simply didn’t update from yesterday?
-
@raven it wouldn’t suprise me if HRV has a very high weighting considering its reliability for suggesting your readiness. If that is the case, I think your score makes sense.
-
@James-Eastwood said in Training readiness would be great for an upcoming update !:
@raven it wouldn’t suprise me if HRV has a very high weighting considering its reliability for suggesting your readiness. If that is the case, I think your score makes sense.
Certainly based on the descriptions given, average/minimum heart rate doesn’t seem to be factored, which is why I suspect that didn’t affect things when that was a bit high. You might be right on HRV being dominated, but then this new feature does not do much that the HRV “green / yellow/ red” does, at least from my perspective.
-
@raven I’m not sure that’s right anyway. Checked mine and it is currently 52%, which seems way too high. My HRV absolutely crashed last night after a 432 TSS event (and, naturally, a couple of beers after). I’d expect it to be well below 30%.
7 day average seems to be the dominant HRV value, but the last value is much more indicative to me.
-
Training readiness is something nice to have, but do people actually follow what the app is telling them? I know how I feel when I wake up, for example today I am tired and fatigued, but the app is telling me I am almost at the peak of my recovery : ) I rather check my resting HR in the morning and maybe HRV, but I know my body and know when to push through and when to rest.
-
@timecode said in Training readiness would be great for an upcoming update !:
Training readiness is something nice to have, but do people actually follow what the app is telling them? I know how I feel when I wake up, for example today I am tired and fatigued, but the app is telling me I am almost at the peak of my recovery : ) I rather check my resting HR in the morning and maybe HRV, but I know my body and know when to push through and when to rest.
For myself, I’m going to continue to check all the data I previous was: overall sleep time last night and sleep trend last few days, overnight HRV and HRV trend, overnight minimum heart rate and average heart rate, my “Resources” value, and my CTL ATL Form from Suunto, in addition to how I feel in terms of muscular strain, etc. This new Readiness number, at the moment, just adds a little bit, mostly a puzzle to determine how it is getting its value. If it had been a simple “ready, warning, stop” with no number, then I’d have nothing to analyze and could quickly check and leave it. Note I don’t think they should simplify it now that it’s in this form. I wouldn’t mind a more detailed explanation of how it is doing the math to come up with the score, so I don’t feel the urge to try to scrutinize it.