Suunto Race S pace track problems
-
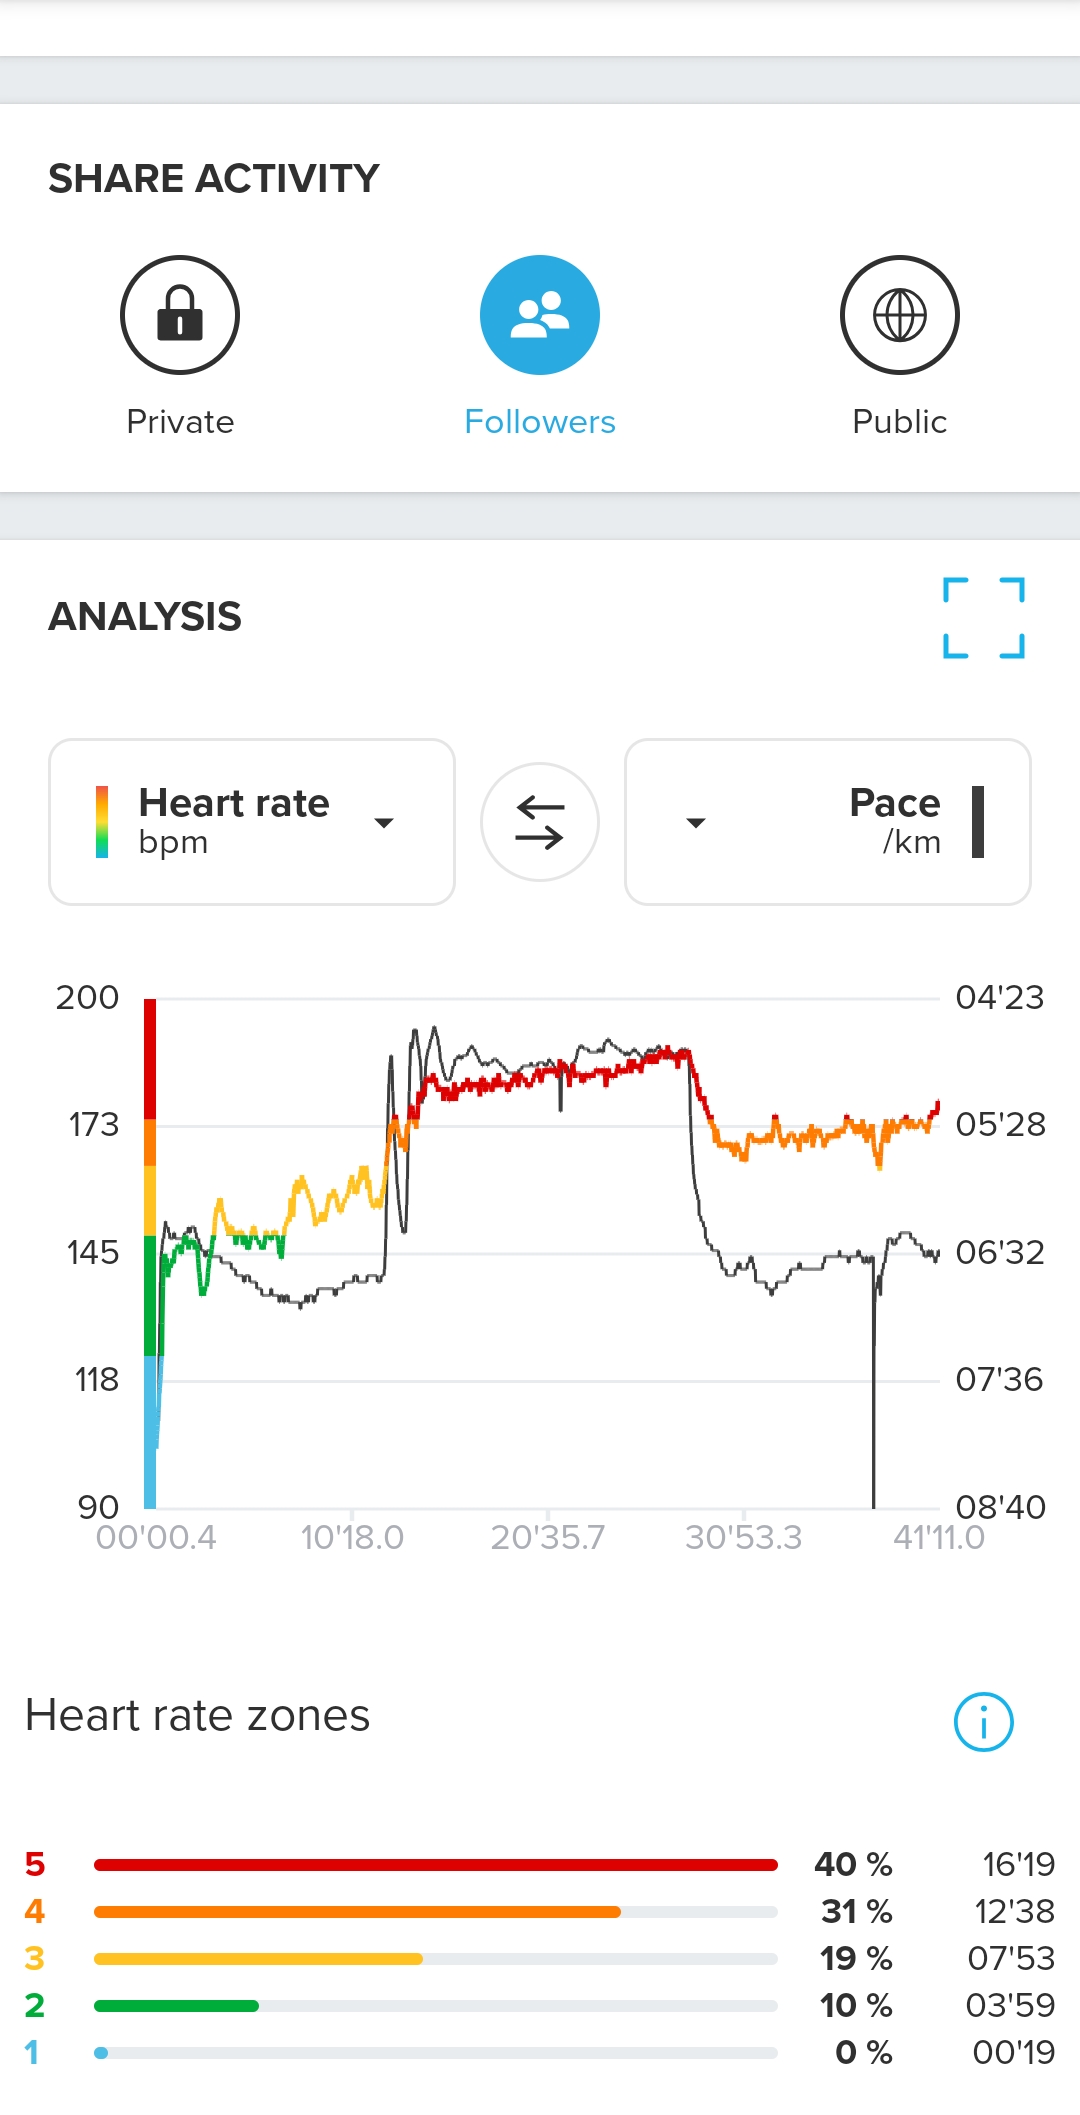
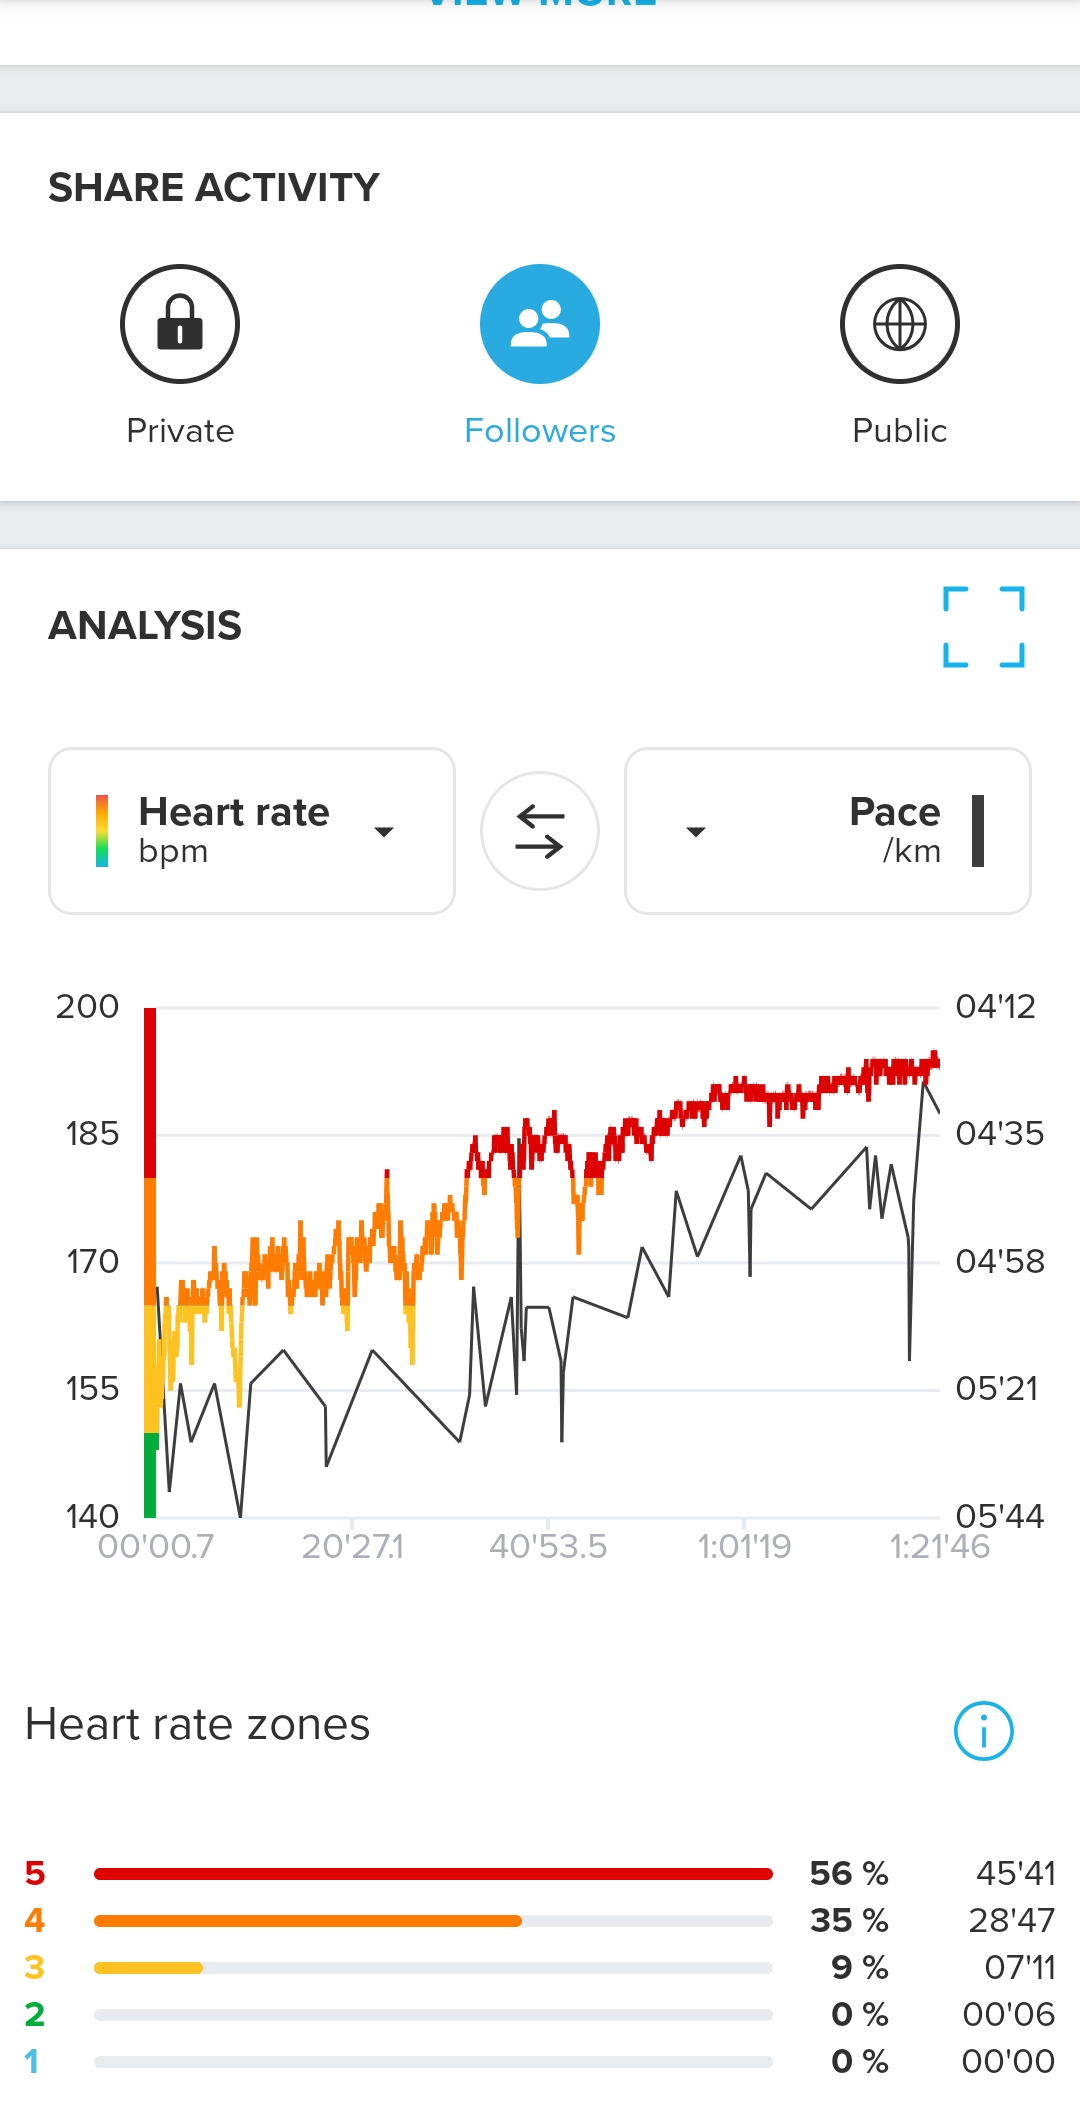
My Suunto Race S is acting up a bit, on my longer runs (over 1hr maybe) the pace track consistently turns out all messed up, discontinuous and jumpy, while on shorter runs it’s smooth and nice. See attached examples for a short run and a longer one.
Anyone has this issue? My GPS is always set to the highest accuracy, battery is high, good reception… What could be causing this? It happens very very consistently
 ️
️
-
Duplicate
-
Duplicate
-
@Chen-Avinadav There is nothing wrong with your Race S or the GPS reception. Upload the .fit exercise file to an analysing site and you will see that the pace/speed variations are smoothly and slowly registered second by second. The Suunto ‘bug’ (as many of us would call it) lies within the Suunto App presentation and graph scale coarseness. It doesn’t have anything to do with the length of the activity; instead the presentation ‘bug’ is triggered by too small pace variations.
Look at your 41 minute exercise. At the very beginning is a smooth acceleration from something like 8:00/km. Also at the ending minutes there is a ‘downwards spike’ of pace drop registered to 8:40/km. At the other pace extreme you hover around 4:40/km. That is a 4 minute difference which allows the Suunto App to draw ‘smoothish’ curves.
In the 82 minute Run session, the pace span is a mere 1m20s circa (4:24-5:44-ish/km), and somehow the Suunto App then thinks it is A-OK to draw a rough sketch of the pace variations; with very few points.
Back a few months ago, when I cared about this issue and actually reported it in this forum, I tried to create smooth graphs by walking at the beginning of every Run session. But due to some delay incorporated in the Suunto App about when to start plotting the pace curve, I had to walk for an overly long time to make that happen. If memory serves me, more than 40 seconds. I decided it to be too much of a hassle…
-
@Inge-Nallsson thanks so much for commenting. After so many Suunto bots on various platforms it’s nice to have a serious reply…
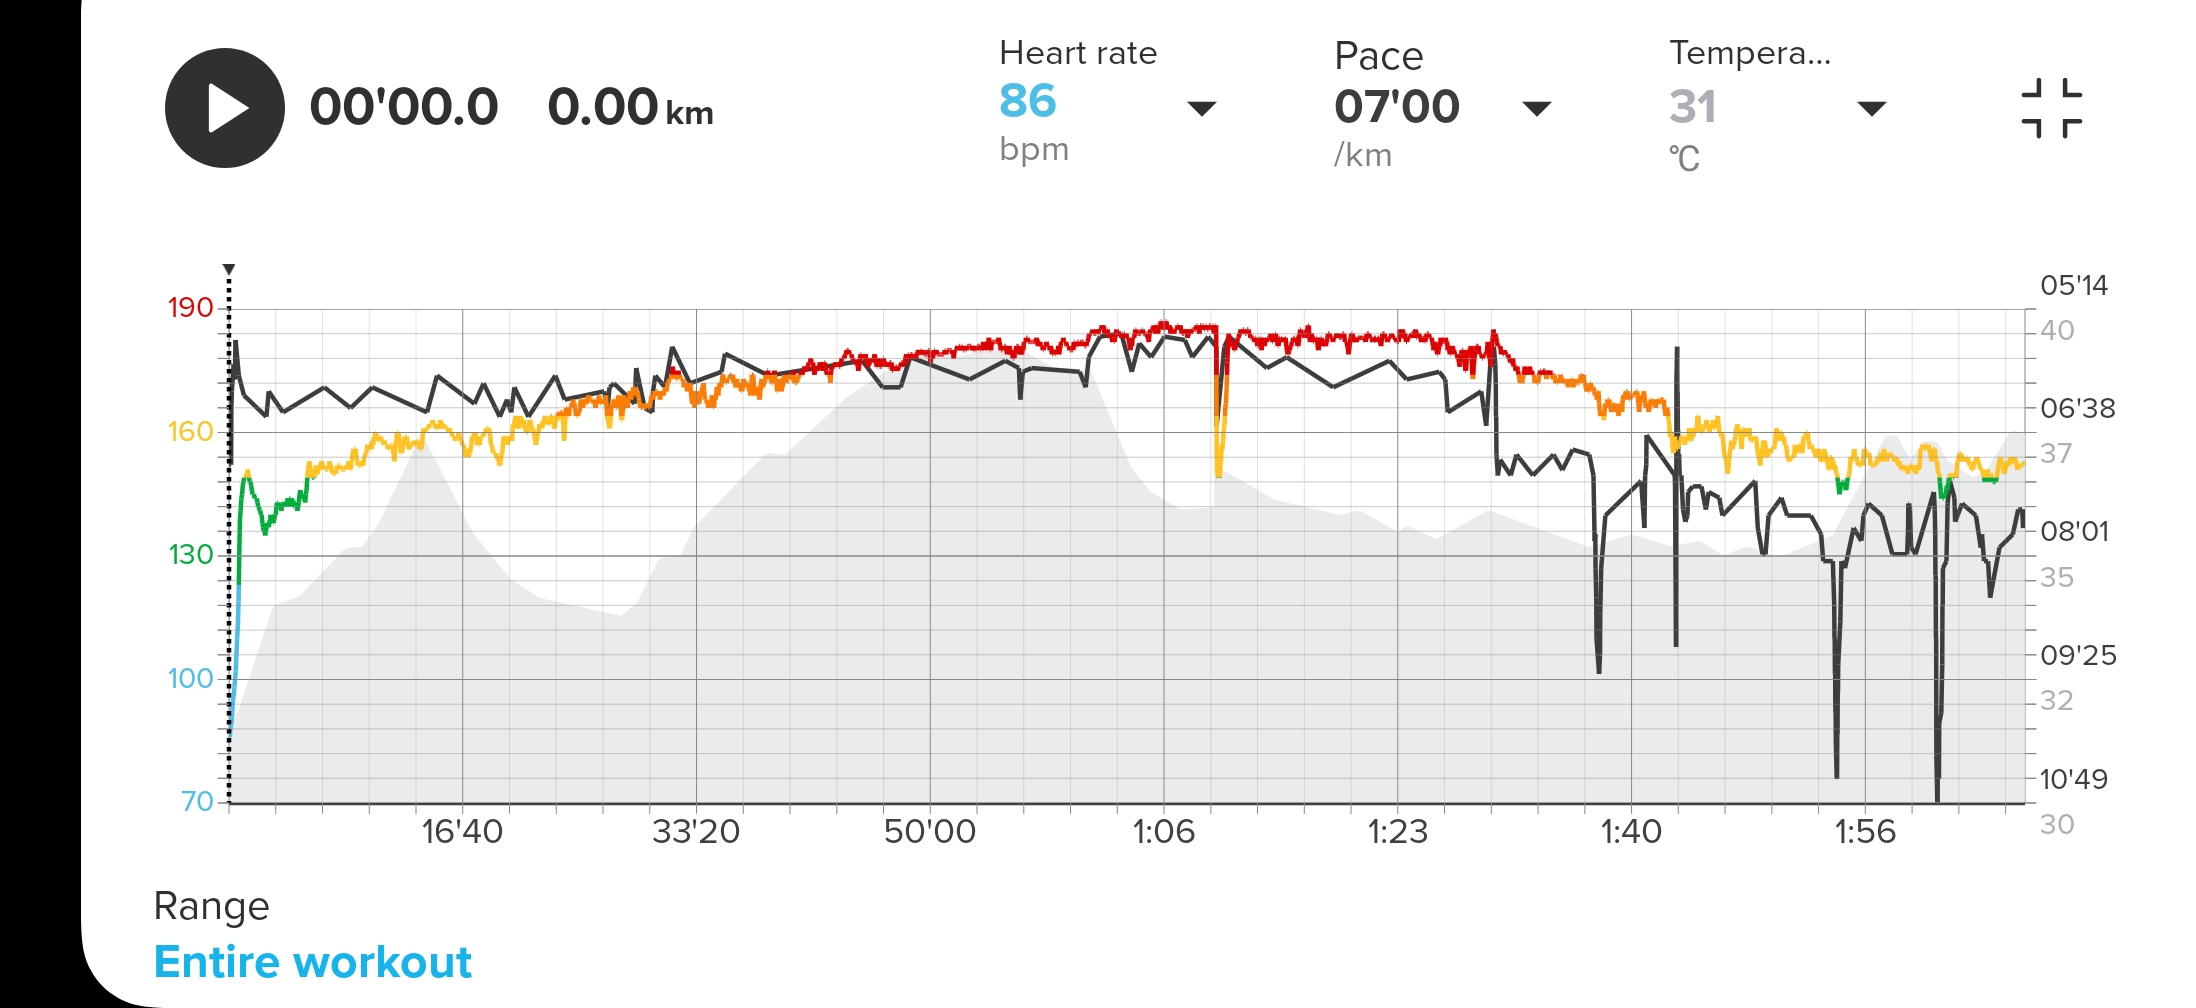
However, I’m not sure I see the behavior you describe. I happened to have a long run on an extremely warm day, which forced very strong pace variations towards the latter part. Still I get a very weird looking pace graph, see below.
I’ll try looking at the fit file itself as you suggested… I agree it’s not a huge deal, at long as the tracking itself and lap pace data is accurate, since obviously I do rely on that for my training.
Edit: yeah just checked on intervals.icu, data looks smooth and perfect on all runs. So I guess it really is a display bug in the Suunto app. Why would they abuse specifically the pace graph on longer activities, the heart rate data remains smooth and high resolution…

-
@Chen-Avinadav said in Suunto Race S pace track problems:
Still I get a very weird looking pace graph, see below.
I stand corrected regarding the simplicity of my assumptions. I have only ever seen it being dependent on pace variations, but your latest example really proves it to involve other things as well - could be a time element.
When I suggested uploading the .fit file to an analysing site, I specifically had those in mind that unpack the data so that you can examine the raw numbers, like at https://www.fitfileviewer.com/ But using a site which displays a nice overall graph view obviously works just as well.
-
Just did some research on all my runs this year…
Every single run that I have done over 1 hour has that graph “bug”. Every run under 1 hour looks smooth… -
@SamuelP thanks for checking and validating my observation. Good to know at least it’s not something specifically wrong with my watch or setup.