Vertical 2 during 14.5 hour long ultra
-
Coming from Vertical 1 and MIP screens this ultra was supposed to be m first real test of AMOLED screen.
My initial concerns:
- battery life - to be honest, SV2 didn’t meet the battery expectations so far, so I was a bit worried
- raise to wake - I was worried that either raise to wake when using poles would trigger the display all the time, or that my gestures will not be enough to trigger the display
- maps - I was afraid that the map screen which I use 99 % of the time during a race will deplete the battery (as it always did with my previous Garmins).
I am happy to report that my concerns were wrong. Before the race I did full discharge and recharge and after 14.5 hours with raise to wake, map screen (and I checked it a lot, nearly every intersection or when I wanted to see how far to the aid station, so by the end, I was checking it almost every 500 meters), the watch lost only 23 % of battery. Which is impressive to me. OHR was on, best GPS settings.
Also the gesture was not a problem at all, always reliable not overly sensitive or registering too much.
Impressive job with the Vertical 2 and happy that I upgraded!
-
@jakubdr that is my experience also. During activity the battery is really impressive. Most I have done since having the V2 is 4 hours. So excellent to read your experience.
-
@jakubdr said in Vertical 2 during 14.5 hour long ultra:
maps - I was afraid that the map screen which I use 99 % of the time during a race will deplete the battery (as it always did with my previous Garmins).
There two reasons map usage depletes the battery quickly when using a Garmin watch:
-
MIP displays consume nearly zero power when the image is static but actually power hungry where the displayed content is very dynamic like a constantly rotating map. That is because the power usage is proportional to the number of pixels that change their state. The power needs to be applied to each individual pixel to flip it. Unlike that AMOLED power consumption is proportional to the overall brightness. I find that high contrast map with the mostly black screen has no detectable impact on power usage. My Race 1 watch used 27% of battery in a 16 hour race while using the map and navigation most of the time, which makes the projected battery life almost 60 hours, which exceeds the official 50 hour battery life.
-
Garmin watches use vector maps where the map image has to be constantly rendered which consumes a lot of CPU resources which is power hungry. That is also why Garmin maps are laggy, especially when there are a lot of details. But on the flip side vector maps are much more compact and detailed and can be routable on the watch. In contrast, Suunto maps are raster maps - basically images that are scaled when the zoom level changes. Raster maps are much easier to rotate, pan, and zoom, which can be mostly offloaded to graphics accelerator chip and not use the main CPU. But the flip side, of course, is that Suunto maps are large in size, take long time to download, and are significantly less detailed, even when details really matter.
-
-
@sky-runner As for point 2, that’s not entirely true. Pick up any professionally published paper map (raster) and look at the amount of detail. Compare that to any vector map.
Vector maps (and graphics in general) are much less resource-intensive than raster ones. Raster maps (generally graphics) are so slow that apart from the background, there is no point in placing additional information on them because it will not work efficiently enough. Where do you think these ideas for removing contour lines, paths and other details from Suunto maps come from?
Probably the slowness of Garmin maps stems from another reason: Garmin watches perform several orders of magnitude more operations, measurements, analyses, etc.
-
@maszop said in Vertical 2 during 14.5 hour long ultra:
As for point 2, that’s not entirely true. Pick up any professionally published paper map (raster) and look at the amount of detail. Compare that to any vector map.
You forget that the same raster images are used for the lowest 5 or 6 zoom levels. I may be wrong but that is what it looks like to me. You cannot make the same image look good at 25m zoom level and at 500m when you zoom in or out 20x.
Also, the more detailed raster images are the less compressible they are, which means map files would have to be extremely large.
-
@sky-runner Garmin maps aren’t small by any means. Every update is several GB, as you can see with Garmin Express…
-
@2b2bff said in Vertical 2 during 14.5 hour long ultra:
Garmin maps aren’t small by any means. Every update is several GB, as you can see with Garmin Express…
Garmin maps are 10-20 times smaller than Suunto maps.
Suunto maps for North America (US + Canada) are 76 GB altogether.
Garmin - 4.4 GB for topo maps that are also quite a bit more detailed and include POIs and labels.
-
While the mere file size does have some impact on resources and battery consumption, I’d agree with sky-runnner, that the rendering process of vector maps is the actual energy hungry beast:
Raster maps come in different layers (resolutions), depending on zoom level. All the watch has to do, is loading part of such a file and put it on the screen. Not much calculation needs to be done there: extract the image part, rotate and display it.
For vector maps, each displayed element has to be calculated and rendered individually - every street, every street name, path, field, etc. This usually involves less data to be loaded from the map files, and yet requires much more processing power. That’s heating up CPUs and drains the battery.
That’s my experience as a software developer. But I don’t know for sure about the watch software here.
-
@Simon Maybe it works differently for maps/watches.
I do some graphics work, and processing larger raster graphics/images is very resource-intensive. Vector graphics are more gentle on the hardware and its resources.
This is generally the advantage of vector graphics. Typically, you can’t achieve visually as good results as with raster graphics, but vector graphics are cheaper (resource-wise). For this reason, car navigation systems are vector graphics.
Suunto maps, despite lacking many details, look much better. -
@maszop said in Vertical 2 during 14.5 hour long ultra:
Suunto maps, despite lacking many details, look much better.
Suunto maps only look better, but are much less usable if we forget for a moment about the navigation layer on top of the map. Consider the map itself. But I would question even the “look better” part. For example consider this screenshot from my weekend trail run and imagine looking at that not on a large screen but on a small watch screen at a distance of extended arm and while running:
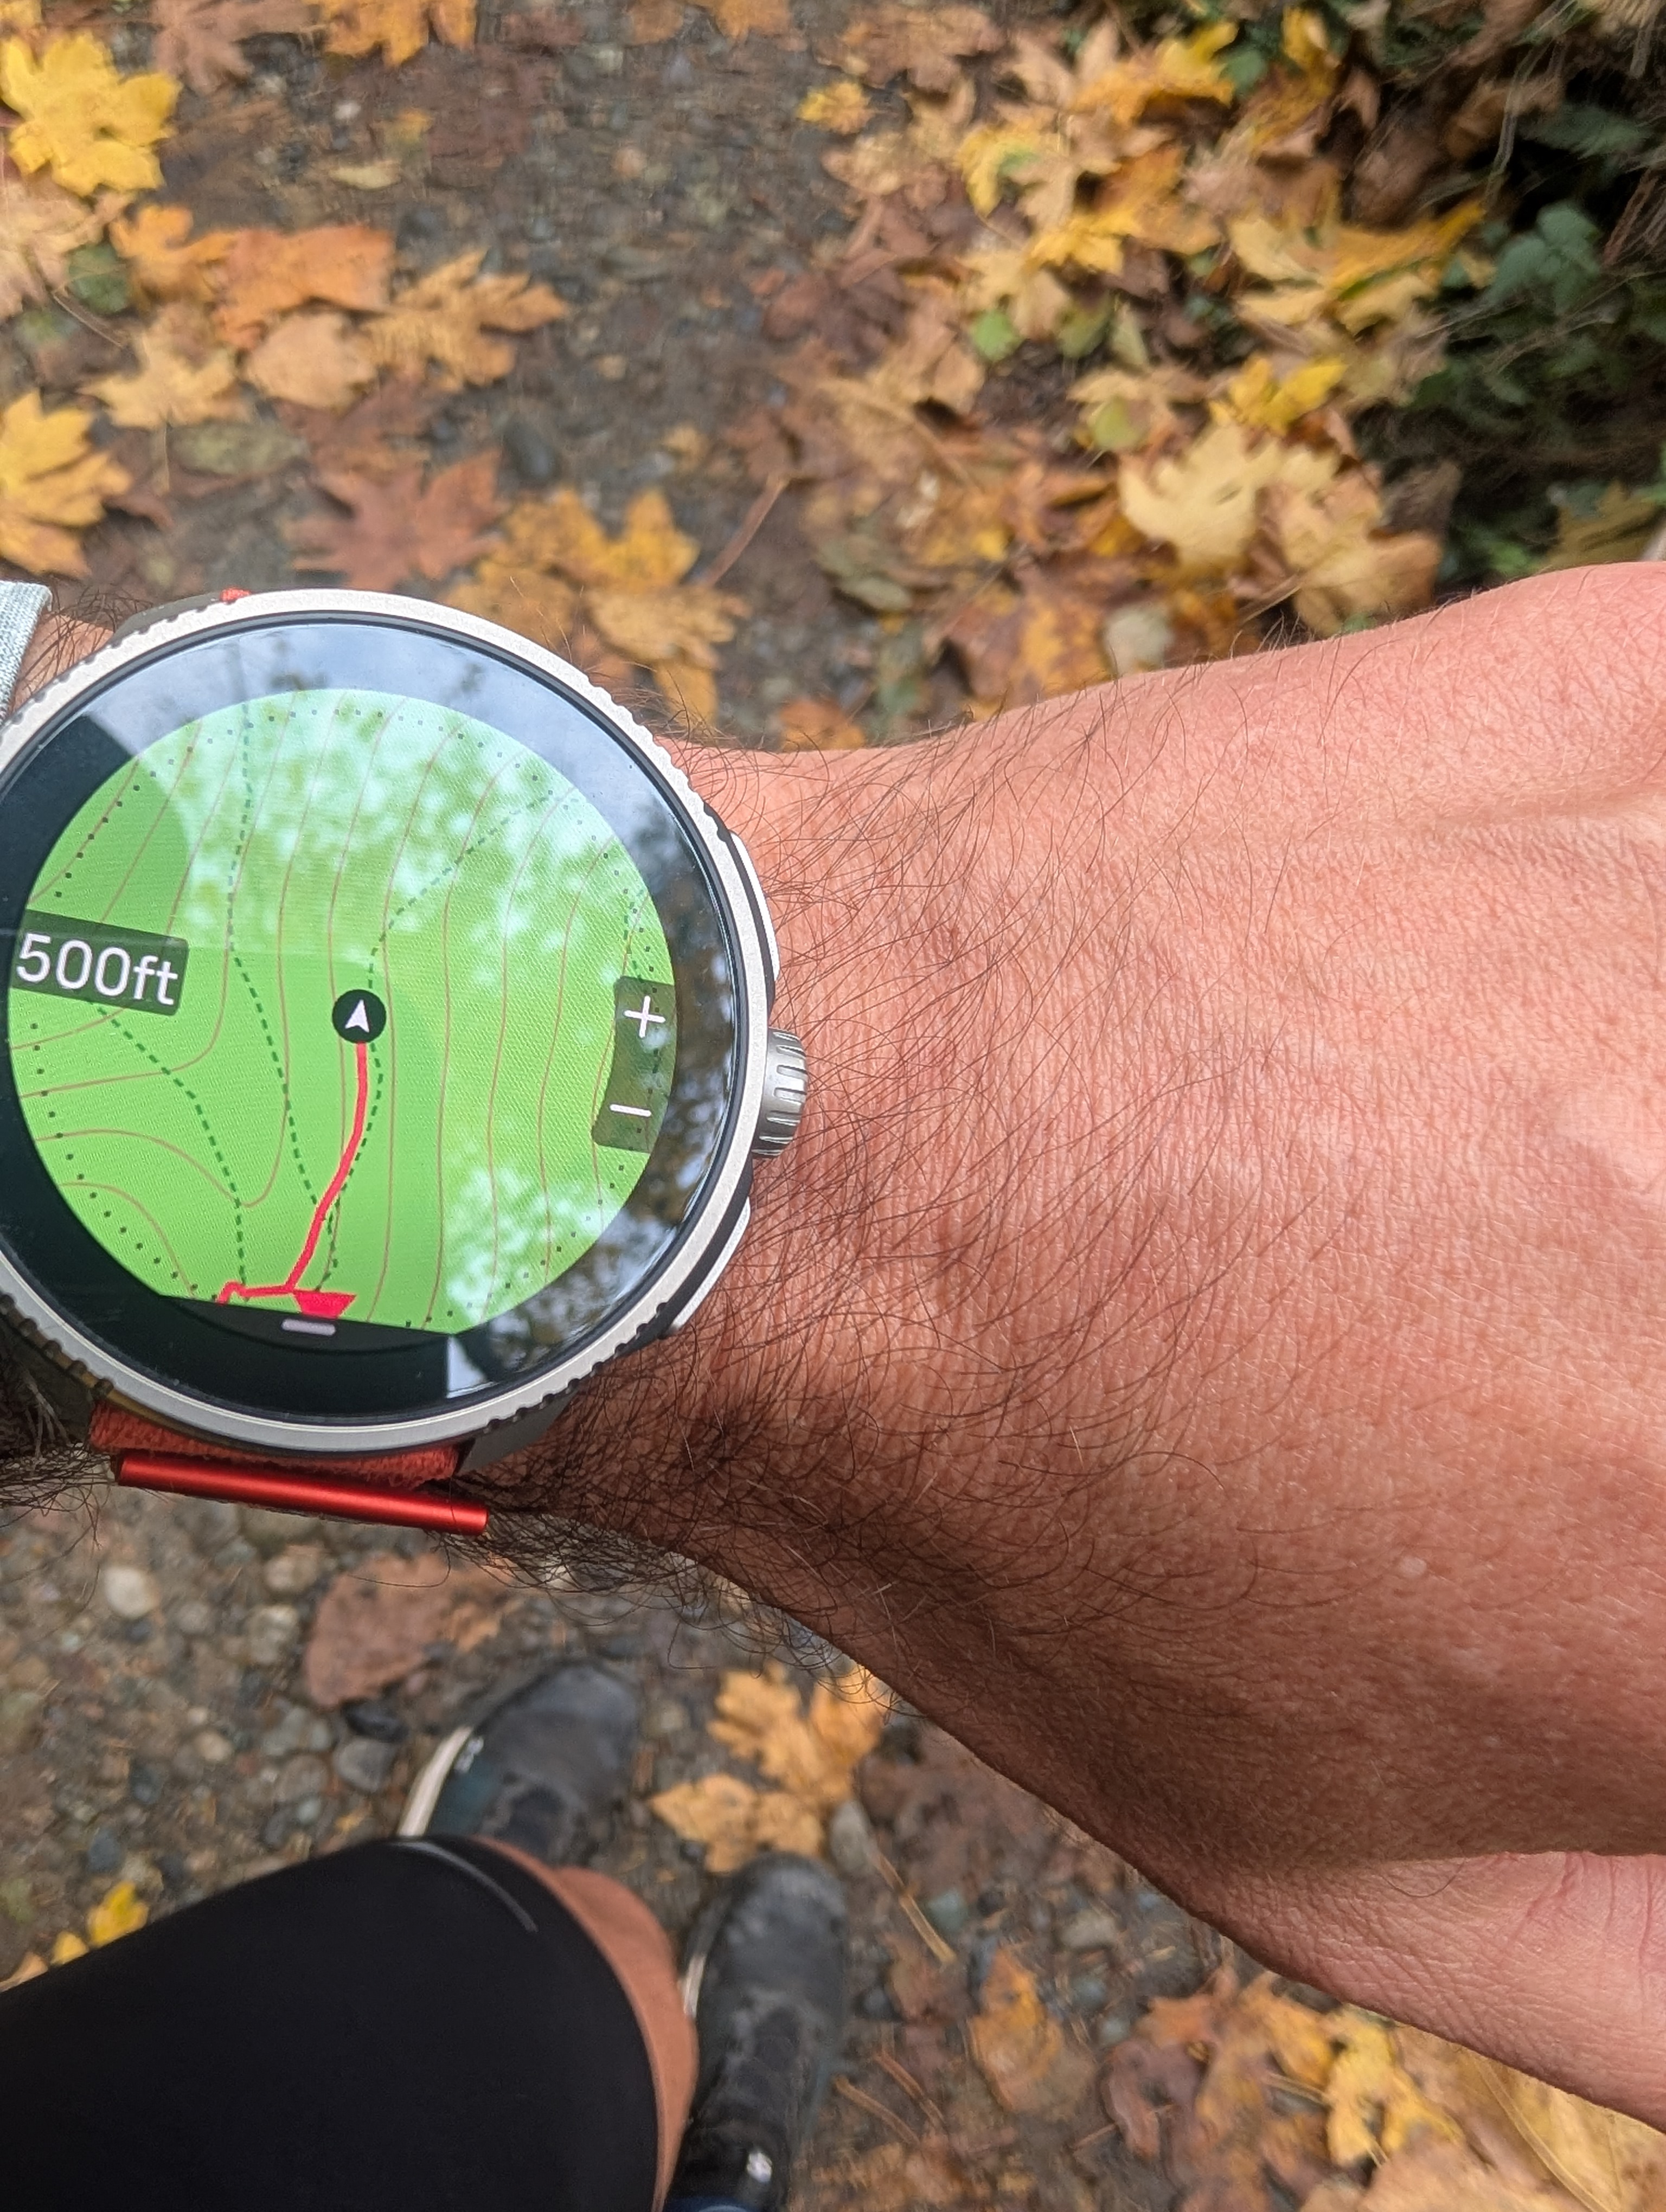
Can you even see what I am talking about? Who thought that rendering trails as green on a green was a good idea? And I don’t even mention that one more zoom out and I’d be staring at a pure green screen with zero details.
-
@sky-runner I have already written here many times that Suunto maps become useless when viewing a slightly larger area. No trails, no paths, no contour lines – just breadcrumb on a colored background.
If there is a place with more landscape elements (lake, fields, cliffs, etc.) then Suunto maps look great.
Regarding your photo, I’ve been concluding for some time that the people responsible for the map’s appearance don’t actually use them in the field. Look at how cartoonishly clear these paths are in the city (they look like some kind of highway), and how difficult they are to see, for example, in your photo.
-
@maszop said in Vertical 2 during 14.5 hour long ultra:
Regarding your photo, I’ve been concluding for some time that the people responsible for the map’s appearance don’t actually use them in the field. Look at how cartoonishly clear these paths are in the city (they look like some kind of highway), and how difficult they are to see, for example, in your photo.
But what I find the most difficult to understand is that not a single reviewer has pointed to this when Race 2 and Vertical 2 were released. I mentioned this issue to two of them in advance, so they were aware, and they still didn’t mention it.
-
@sky-runner this is why I don’t watch review videos anymore. People act like they are the only source of truth and the holy grail. I find it amusing when somewhere online uses “but DC ray said” as an argument. They touch just the surface, show the user interface, show HR comparison on one or two activities, then conclude for whom this watch is. There are a few exceptions, but 90% of them are like that. In entertainment terms I would say it’s “lazy writing”.
-
I think the maps are very useful. But there needs to be said I come from no map on my previous watch (Polar Grit X), only a breadcrumb trail. I find it easy to determine my path and orient with it. The only thing I would ask is paths visible to 500 m or maybe 1 km. But that’s all
-
@Horizontal_2 said in Vertical 2 during 14.5 hour long ultra:
The only thing I would ask is paths visible to 500 m or maybe 1 km. But that’s all
I used to be that way until July 2025. Then Suunto has “optimized” it in the 2025 Q3 update, shortly before the release of Race 2. At least on my Race and Race S watches configured with imperial units, I could see trails at the 0.5 mile zoom level, which is 800 meters.
Can anyone from Suunto explain why this has been changed?
-
@sky-runner said in Vertical 2 during 14.5 hour long ultra:
Can anyone from Suunto explain why this has been changed?
No, the claim is Suunto doesn’t watch this forum…

-
@sky-runner
I am not sure where the claim that Suunto maps are raster-based comes from, maybe others have different definitions. But: The maps on my Race S are definitely vector graphics, not raster(=pixel) images. Just observe dashed lines while zooming for a clue. Map data clearly is split into tiles, though, which explains the lack of (difficulty to do) routing on the watch.My previous watch had no maps and I definitely find them useful despite their limitations, hoping that they finally fixed the “some tiles randomly won’t load” bug.
-
@jakubdr I was skiing 4 hours with 6% battery consumption, OHR on, best GPS, chest belt connected, slalom skis - it means many turns with arm raise to wake :-), so I am very satisfied with batery comsumption
-
@Jan_B said in Vertical 2 during 14.5 hour long ultra:
I am not sure where the claim that Suunto maps are raster-based comes from, maybe others have different definitions. But: The maps on my Race S are definitely vector graphics, not raster(=pixel) images
I am pretty sure this has been discussed before and the conclusion was that Suunto maps were raster based, and that’s why the maps are so much larger in size than Garmin maps and also that’s why rotation is so much more smooth.
However I started to research it last night and I am no longer sure. On one hand if you look at how building outlines scale, how multiple buildings merge together into formless blobs when scaling out, that points to image scaling. On the other hand, the way trails and roads scale, does no longer look like image scaling. I think that perhaps it now may be a combination of raster based and vector based layers, and that may also be the reason why rendering has changed in the 2025 Q3 update as discussed in https://forum.suunto.com/topic/13311/map-rendering-and-trail-visibility-after-software-update-2.43.8-.12 thread.
The Mapbox website does mention some innovation with Suunto and in particular this:
“The combination of Mapbox Tiles and Static Images API enables wristwatches map experience as effective as in mobile apps”
https://www.mapbox.com/showcase/suunto
Perhaps someone from Suunto who knows more details may shed some light if that isn’t a secret.
-
@sky-runner good find, but AFAIK mapbox is only used in the app, not on the watch…
Hello! It looks like you're interested in this conversation, but you don't have an account yet.
Getting fed up of having to scroll through the same posts each visit? When you register for an account, you'll always come back to exactly where you were before, and choose to be notified of new replies (either via email, or push notification). You'll also be able to save bookmarks and upvote posts to show your appreciation to other community members.
With your input, this post could be even better 💗
Register Login