Suunto SHRB2 Firmware 3.2.6.8 Update
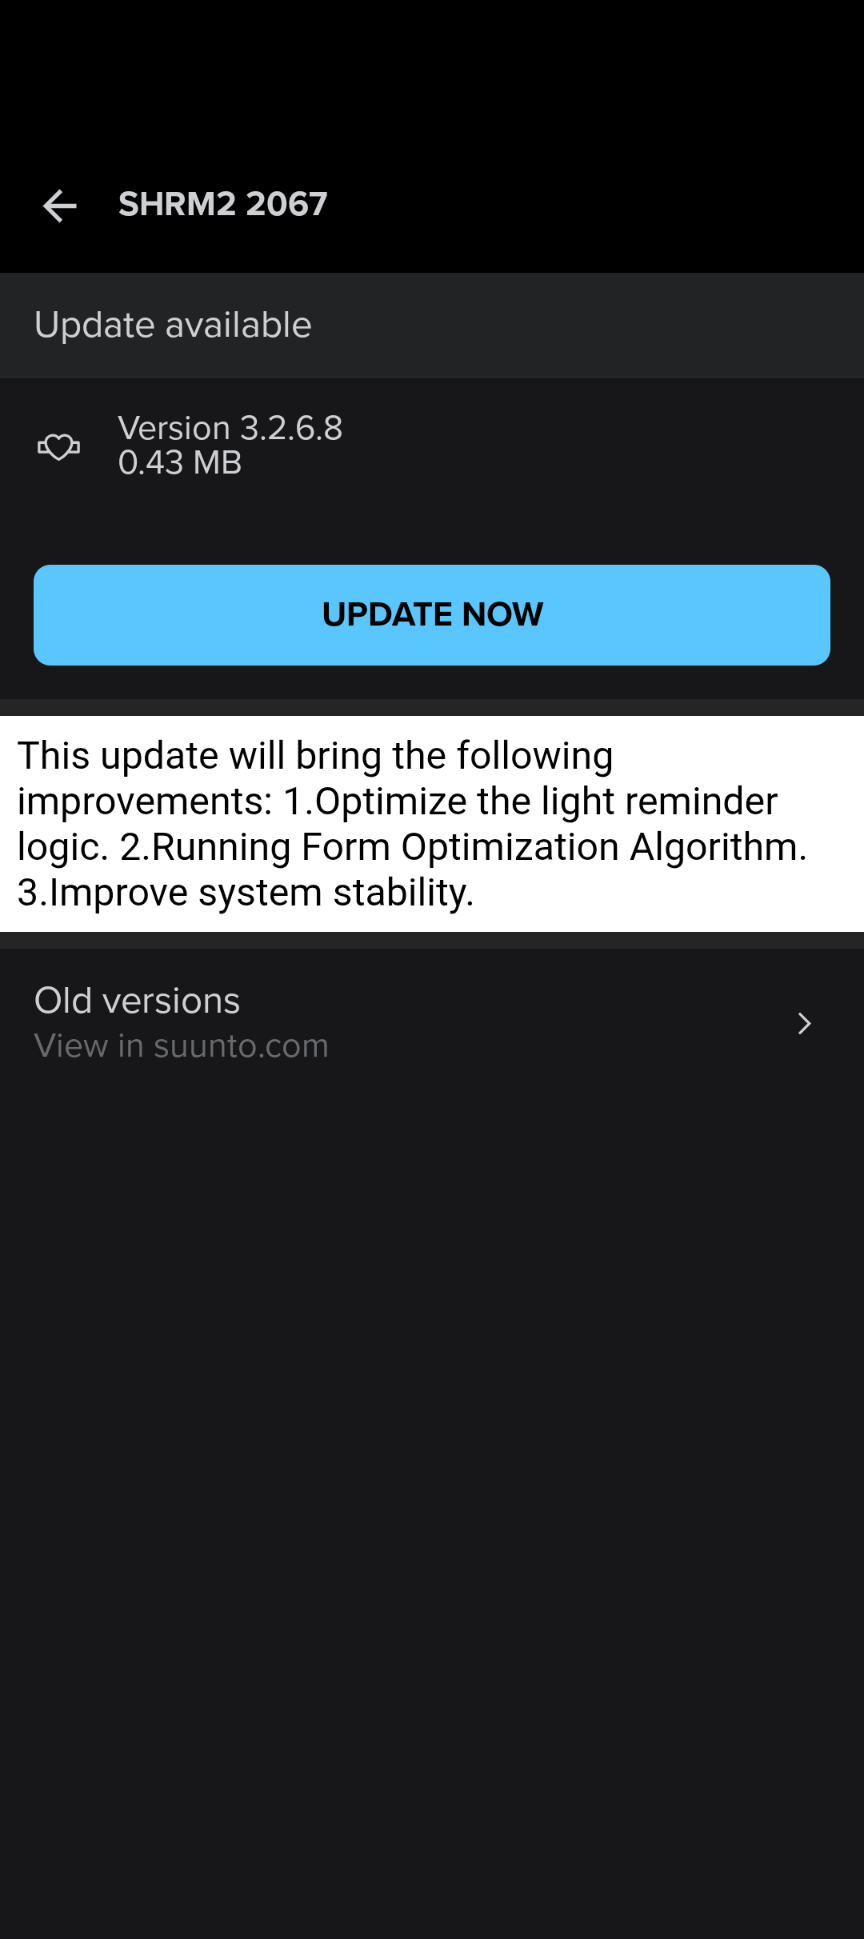
-
I tested the LED behaviour in relation to connections with both the Suunto App and the Race S. First with Firmware 3.2.6.2, and after upgrade with the 3.2.6.8 version. It was not easy since the two choices we are offered didn’t really seem to stick until I had revisited the App page again after a change. Also, the use of different colours and number of flashes and number of sequences just made my head hurt, as well as question what I just had written down. Take the below with a pinch of salt, and perhaps do tests of your own.
The explaining text in the Suunto App [upper left hand corner HR icon] --> “Battery mode” is strange and only correct in parts and in a general sense:
“Power saving” [Default mode]
“The blue indicator light does not flash to show the number of connected hosts in this mode”“Normal”
“When enabled, the indicator light will stay on continuously”The “Power saving” behavior with 3.2.6.2 was:
Strap on chest: LED Off.
Connection to App or watch running activity: LED Single green flash.
While connected: LED Off.
The “Normal” behaviour was:
Strap on chest: LED Off.
Connection to App or watch running activity: LED Single green flash.
While connected: LED Double green flashes every 5 seconds.
These double flashes continued as long as the strap was on the chest, also after the running activity, and only quit 5 to 6 minutes after the strap (or pod) was removed.
The “Power saving” behavior with 3.2.6.8 is:
Strap on chest: LED Off. (Or the same as in “Normal” mode… It seems to vary… Or not stick)
Connection to App or watch running activity: LED Single (or double?) green (or blue?) flash. With the watch there then was a 4 times sequence of double green flashes.
While connected: LED Off.
The “Normal” mode has a lot of LED flashes:
Strap on chest: LED Single green flash every second until removed, plus 3 minutes. The flashes can start just by touching one of the electrode studs, or when snapped on, touching a plastic strap electrode. If not on chest the flashes stop after 3 minutes.
Connection to App or watch running activity: LED Single (or double?) green (or blue?) flash. With the watch there then was a 4 times sequence of double green flashes.
While connected: LED Off.
Yikes… Not clear at all! Sorry.
-
I was hoping the update would address this, but I guess not.
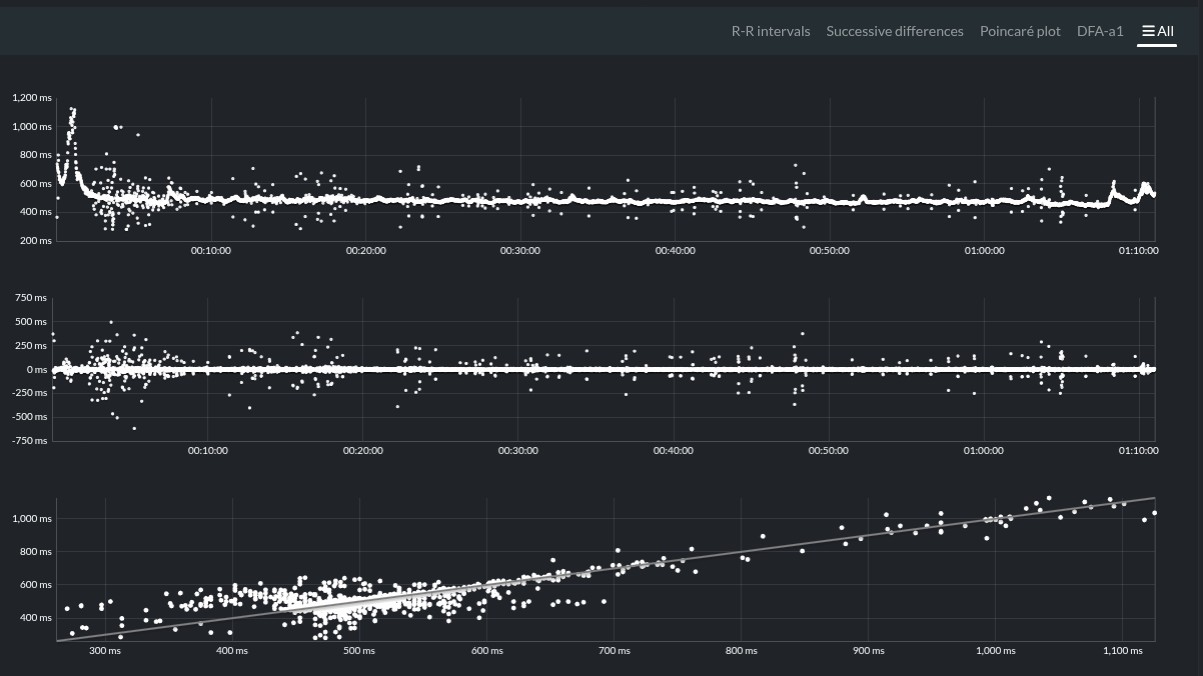
However, I think the flight time is per step, rather than per stride. IE, you’re in flight until a foot hits the ground, then you’re not. You’re in flight again until the opposite foot hits the ground. So your flight time is between left/right steps.
The math checks out for me:
- Cadence = 170 spm
- Time per step = 1/170 spm
- => (1 min / 170 steps) * (60,000 ms / 1 min)
- => 60,000 ms / 170 steps
- => 352.9 ms/step
- Flight time = time per step - ground contact time
- => 352.9 ms - 295 ms
- => 57.9 ms
- GCT:FT ratio
- Ratio = GCT/FT
- => 295 ms / 56 ms
- => 5.27 or 527%
- Share of each step on the ground
- 295ms / 352.9 ms = 0.84 or 84%
Suunto Race S / 9 Baro / Ambit 3 Peak / Observer
Suunto SHRB2 / Polar H10 / Verity Sense / OH1
Stryd Duo / Wind
r/suunto mod - Cadence = 170 spm
-
I was hoping the update would address this, but I guess not.
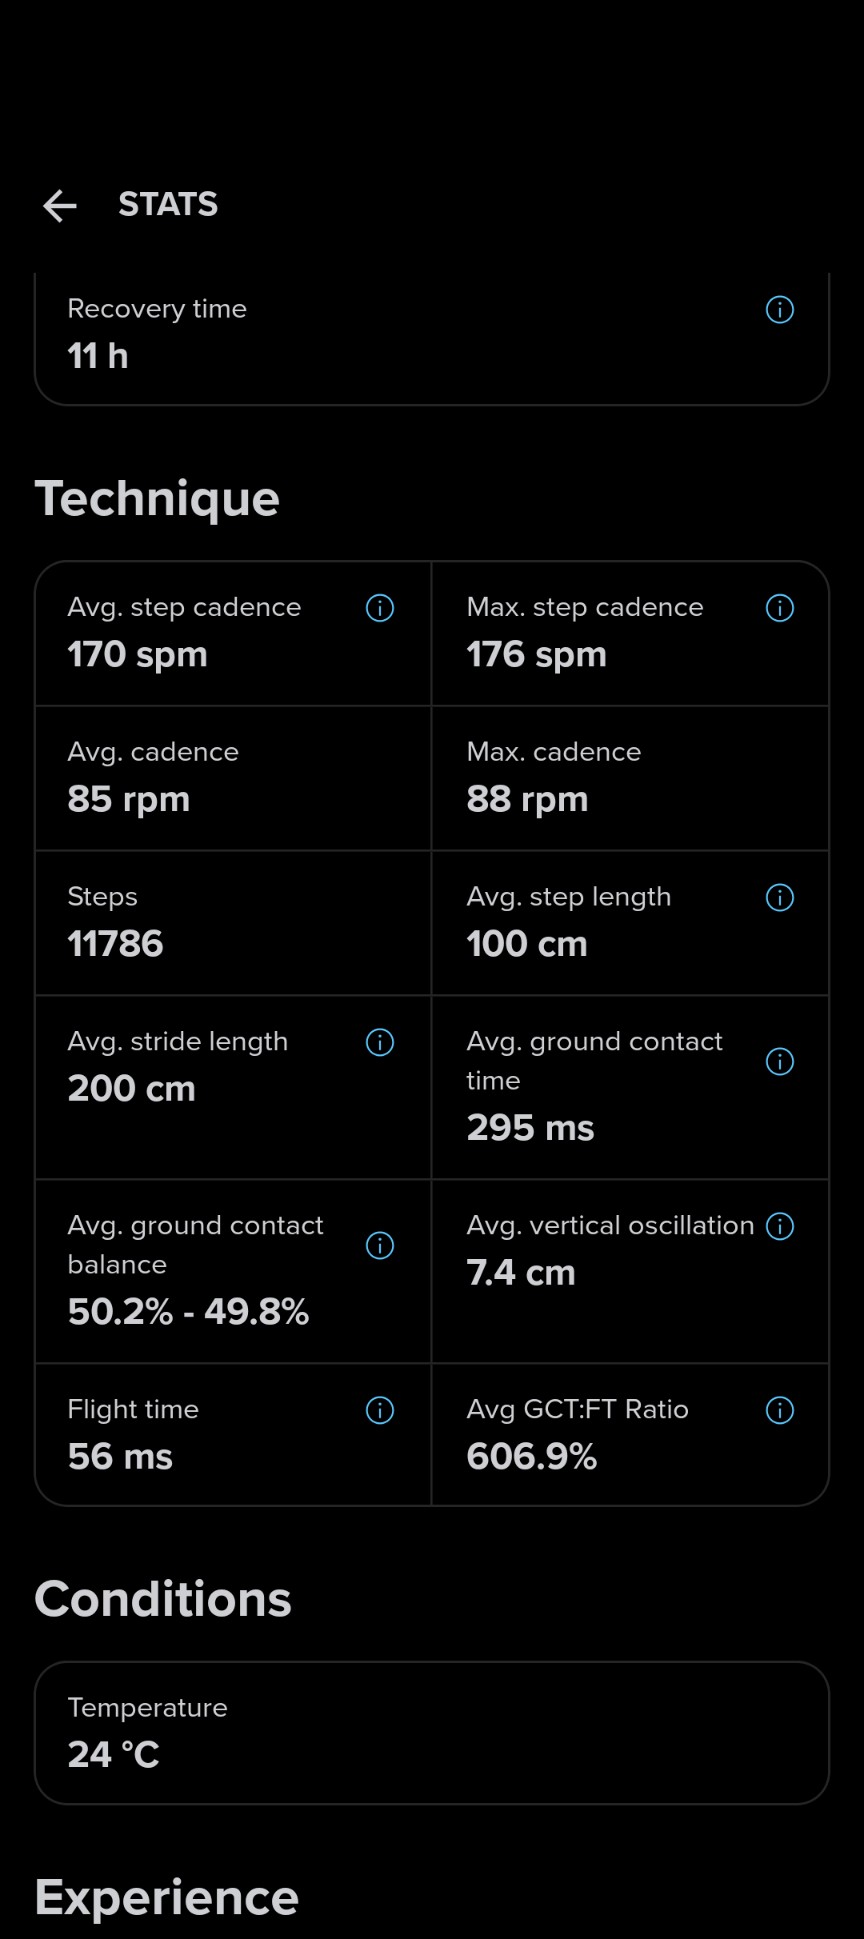
Thanks for posting that so I didn’t have to try it. Instead I could test a new length of protective rubber tubing. Yesterday, while using the old short version, I discovered that the twisting of the torso made the tube migrate, slide a bit to the side, and expose ca 1/3 of the SHRM2 pod. This led to HRV noise in the latter part of the run. Anomalies was still 0.0% but the Artifacts stood at 2.0% according to Runalyze. Today I used a 70 mm length of the old bicycle inner rubber tube (round diametre ca 30 mm, flattened the height is ca 46 mm). It stayed in place beautifully and the Anomalies were back to 0.1% with Artifacts at 0.2%.
When it comes to Running Form I now have numbers from both Firmware versions. The only parts that I can put a firm handle on is Pace and Cadence, and using 180 bpm cadence music* allowed me to focus on the pacing, where I with success managed the intended ca 6:30/km.
Let me just get this out of the way and say that the “Flight time” and “Avg GCT:FT Ratio” in this last Firmware are crazy numbers! I can’t wrap my head around the numbers from the old version either, but at least they were worthy of questioning and computation. I’ll write all the numbers that can be squeezed from the App below, as well as the wrist-based equivalent from the Garmin Forerunner 955 control watch.
Both runs had “Avg. ground contact balance” of 50.0% - 50.0% which also is a bit strange since all of my running shoe soles have a wear pattern speaking of an imbalance.
FW 3.2.6.2 6.00 km, 00:38:50.5, 6947 steps:
Avg Pace: 6:28/km
Avg Ste. Cad: 180 spm
Avg Ste. Len: 86 cm
Avg GCT: 343 ms
Avg VO: 5.3 cm
Avg FT: 324 ms
Avg GCT:FT Ratio: 106.0%FW 3.2.6.8 6.01 km, 00:38:53.4, 6920 steps:
Avg Pace: 6:28/km
Avg Ste. Cad: 180 spm
Avg Ste. Len: 86 cm
Avg GCT: 342 ms
Avg VO: 5.3 cm
Avg FT: 1 ms
Avg GCT:FT Ratio: 11320.4%FR955 6.03 km, 00:38:55:
Avg Pace: 6:27/km
Avg Run Cad: 179 spm
Avg Stride Len: 0.86 m
Avg GCT: 266 ms
Avg VO: 7.4 cm
Avg Vertical Ratio: 8.6%Here are kilometre by kilometre numbers for the interested mathematician:
FW 3.2.6.2 Avg Pace, Cad, GCT, VO, FT, GCT:FT
6:30, 90, 341, 5.6, 323, 105.1%
6:27, 90, 343, 5.3, 324, 105.9
6:28, 90, 345, 5.2, 322, 107.2
6:26, 90, 344, 5.2, 325, 106.2
6:25, 90, 343, 5.2, 323, 106.2
6:30, 90, 342, 5.2, 324, 105.6FW 3.2.6.8 Avg Pace, Cad, GCT, VO, FT, GCT:FT
6:31, 90, 337, 5.6, 2, 9639.4%
6:29, 90, 344, 5.3, 0, 12104.8
6:27, 90, 344, 5.2, 1, 15041.3
6:27, 90, 344, 5.2, 1, 12659.3
6:26, 90, 343, 5.2, 1, 11125.8
6:28, 90, 343, 5.2, 0, 13166.7[I thought division by zero was forbidden… And observe how same GCT with same FT produce wildly different GCT:FT percentages]
FR955 Avg Pace, Cad, GCT, VO, Vert. Ratio
6:30, 177, 266, 7.3, 8.6%
6:28, 180, 266, 7.4, 8.6
6:27, 180, 266, 7.4, 8.6
6:26, 180, 267, 7.4, 8.6
6:24, 180, 266, 7.4, 8.6
6:27, 175, 266, 7.3, 8.4All the numbers are correctly transcribed from the Suunto App and Garmin Connect.
* Cadence mp3 from Steve Boyett at https://www.podrunner.com/about.html
-
Forwarded this discussion to the product manager at Suunto

-
tried this morning the new fw (don’t pay attention to the noisy part—I was fiddling with my running vest)
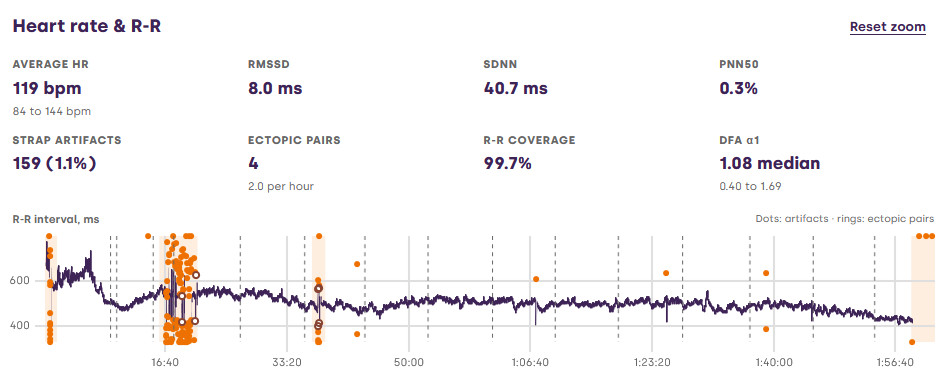
thanks @łukasz-szmigiel for this handy toolthat said I keep trying with ESD tape/bags (not used in the above run)…
-
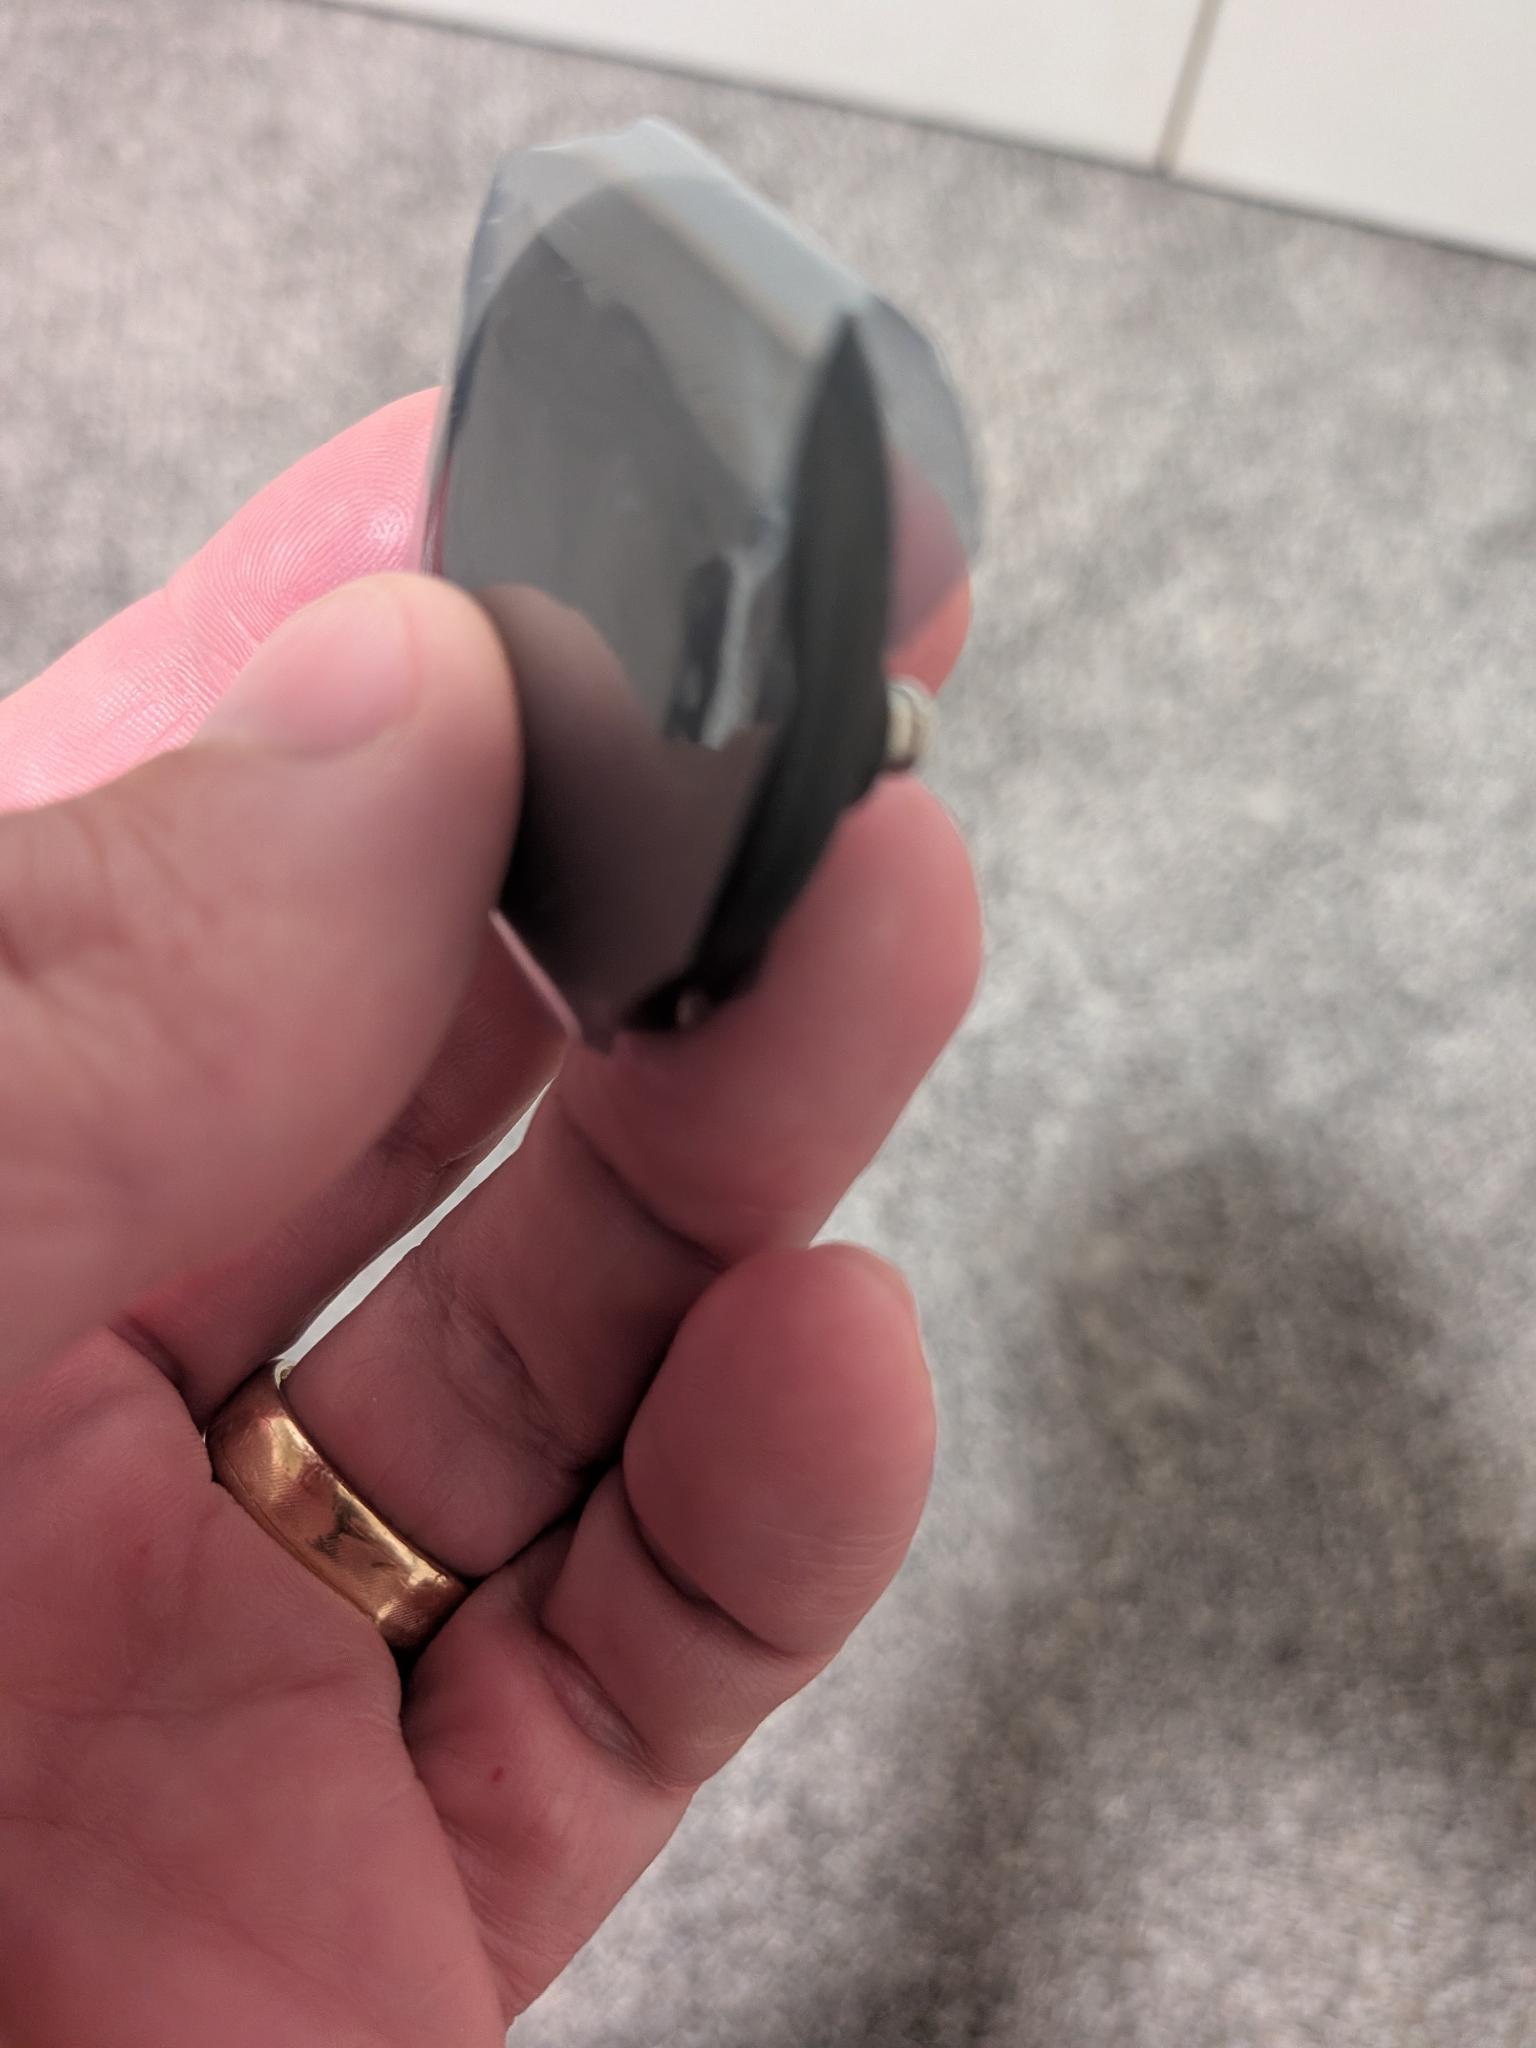
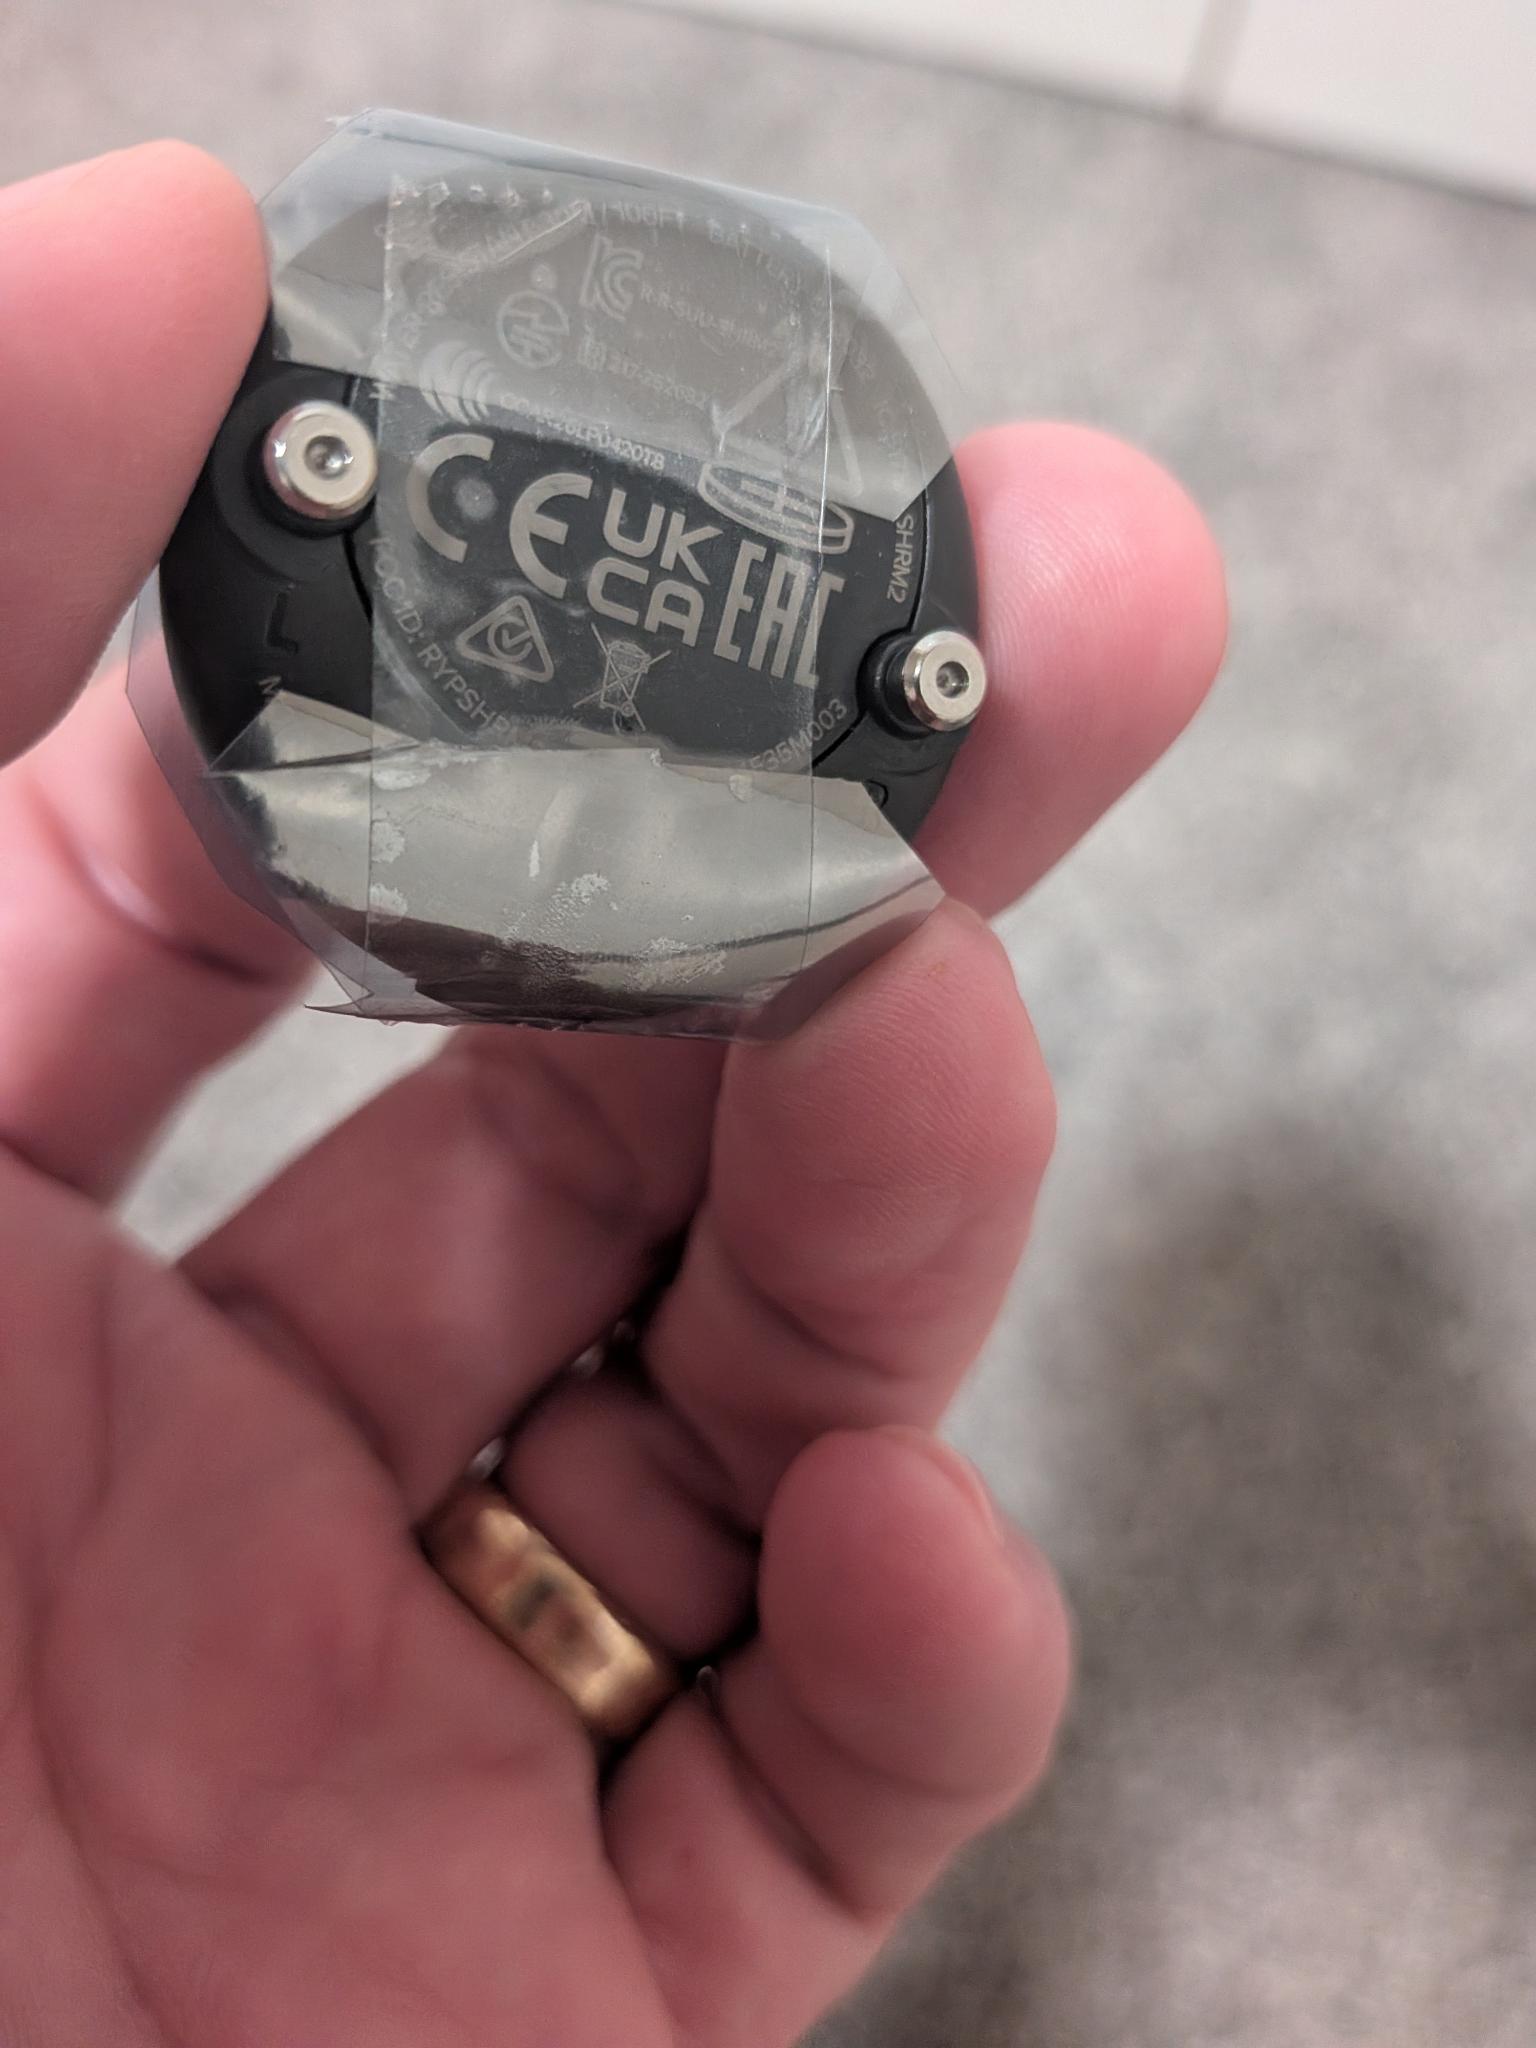
@snow I’m about to test the same. I chopped up an ESD bag hard drives come in, wrapped it around the module, and taped it to the back careful to not short the snaps. About to head out on a run with it now and see how it performed.
Suunto Race S / 9 Baro / Ambit 3 Peak / Observer
Suunto SHRB2 / Polar H10 / Verity Sense / OH1
Stryd Duo / Wind
r/suunto mod -
Hello little have returned to the previous version that version is meh the flight times no longer work 45 ms the previous outputs were at 290 ms thank you
-
the flight times no longer work 45 ms the previous outputs were at 290
they’ve probably changed the FT (FT = Duration of a single step - GCT) calculation and imo it’s not wrong when viewed in the context of the other data e.g. see @atoponce math (well, there’s still something that needs to be fixed, since @inge-nallsson’s FT value is 0…)
-
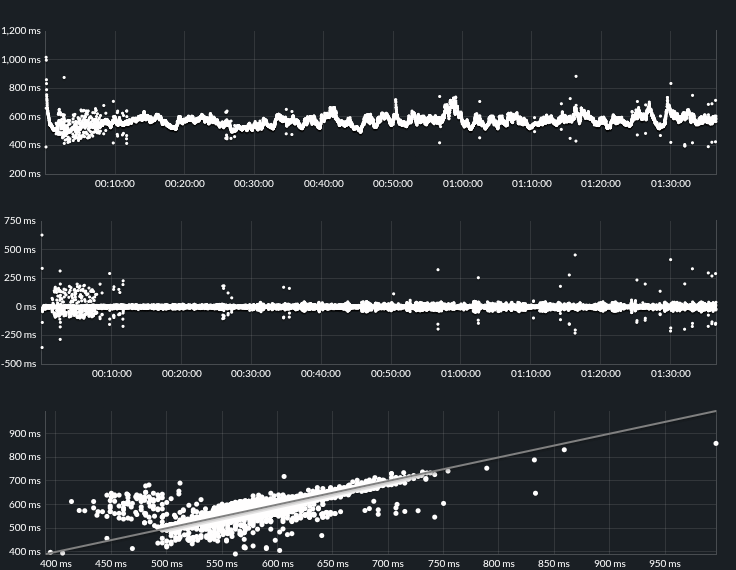
About on par for me when it’s not shielded. Although 0.0% anomalies, which is different. This was a trail run with friends.
-
A bit more input from my side. A run today of mixed-pace short intervals. Data with 3.2.6.8 FW and compared to Stryd Duo.
The overall run
Metric Suunto Stryd Step Cadence 150 151 GCT 435 457 FT 1 N/A GCT:FT 2419.1% N/A GCT * Step Cadence / 60 (= Duty Factor) 1.09 1.15 The formula for Duty Factor (DF) assumes that GCT is per individual foot. Which in this case means I am mostly walking, GCT > Step time.
Let us compare some intervals at a higher pace to see how they differ. I am using only Suunto numbers here. I can provide Stryd if it is of interest.
Interval Pace Cadence GCT DF Note 4:10 208 297 1.02 This is a 30s interval for me 5:15 176 347 1.02 This is about VO2max pace for me Full disclosure, I am 70+ years old. Not especially fast. My running style is fairly flat. I have run mostly half marathons and full marathons during my 25 years of running.
My current absolute max pace is 3:30. But based on the duty factor numbers it looks like I would still be walking

-
I reset the belt and tried again over 10 minutes and the flight time returned to normal 245 ms suunto updates are deplorable forced to reset everything after each update show included
-
@matram interesting.
Your GCT is 435 mS, while the step duration is 400 mS. It seems that when the GCT is greater than the step duration, the FT becomes 0 or so as if to tell you that you are “always” in contact with the ground.
same applies to @inge-nallsson e.g.
GCT 337mS
Step cadence 180 so step duration is 333mSAgain GCT > SD
Does that make sense?
-
@ggrego
Just to clarify. I did a factory reset after the update of the FW and had to re-pair the belt with my iPhone and Watch. This took several attempts.My old Polar H10 updated FW more easily and cleanly.
-
@snow
Maybe, I could buy that for a very slow recovery run at 7 - 8 min pace.But 4:10 pace is very close to my absolute limit and it sure does not feel like I am speed walking.
But it seems like I am in good company with other walkers

It comes back to, if GCT is for one foot per step or for both feet per stride, the rest follows mathematically. I guess Suunto should provide an authorative answer to clear up the confusion.
-
Hello, did he notice that since the update the belt remained on standby? It no longer cuts. The sensor connects directly to the watch even without being attached to the strap
-
@ggrego The device will automatically turn off after 3 minutes without contact with the module.
-
Not for me it remains active even without the strap after several hours
-
A correction to my previous post first. The formula I used, GCT × step cadence / 60, gives GCT / step time, not duty factor. Duty factor is defined per stride (two steps):
Duty factor = GCT × step cadence / 120 (GCT in seconds)
So the boundary for “no flight phase” is DF = 0.5, not 1.0. My conclusion that GCT > step time was still correct for those numbers, but the numbers were wrong.
I analysed Suunto (FW 3.2.6.8) and Stryd Duo FIT files second by second and looked at each workout segment, skipping the first 6 s of the 20 s intervals and the first 10 s of longer
Segment Pace spm GCT Suunto GCT Stryd Flight Suunto Flight Stryd DF Suunto DF Stryd Easy (10 min) 8:06 157 436 425 −51 −42 0.57 0.55 20 s interval 3:51 211 250 224 +49 +61 0.42 0.39 20 s interval 4:12 202 263 239 +39 +58 0.43 0.40 90 s interval 5:22 178 344 309 −5 +29 0.51 0.46 Walking recovery ~11:00 110 ~470 ~650 +75 −110 0.44 0.60 (GCT and flight time in ms. Flight time = 60 / cadence − GCT.)
What I see:
- Suunto’s GCT lags about 6 s. At the start of each interval it holds the previous walking value (480 ms) for several seconds before dropping to about 245 ms. In a 20 s lap this pulls the lap average up a lot, which explains the 297 ms I reported earlier. The steady part of that interval was about 245 ms, with a clear flight phase.
- When running, Suunto’s GCT is about 25–35 ms longer than Stryd’s. Near the boundary that’s enough to turn a positive flight time negative: −5 ms versus +29 ms in my 90 s interval.
- During walking, Suunto shows a near-constant 465–480 ms and positive flight time, which can’t be right for walking. Stryd shows about 650 ms (DF 0.60), a normal walking value. It looks like Suunto’s GCT isn’t measured directly in that range.
- At easy pace, both devices agree that I have no flight phase (DF about 0.55). That’s not walking, though. It’s “grounded running”: running mechanics, with the body lowest at midstance, but one foot touches down before the other leaves. It’s common at slow paces, especially for us older runners.
So for anyone puzzled by odd flight times: check the second-by-second data and skip the start of any short laps before drawing conclusions. Over longer steady segments, Suunto and Stryd are fairly close, with Suunto reading somewhat longer GCT.
-
One aspect of this device that I’m interested in is the information related to vertical oscillation. It’s an area that I think I need to improve (more forward motion and less ‘up and down’) but that is based on the data generated by the Garmin 955 that I sometimes wear. I noticed that in the comparison between SHRB2 and a Garmin 955 (a few posts earlier) the latter showed a higher number for VO, compared to the Suunto device. This makes sense to me, as it must surely be more difficult to measure this characteristic using a device that’s being swung back and forth, whilst simultaneously going up and down, compared with something that’s fixed to the torso.
Have any other SHRB2 users, that are in a position to compare with wrist based data, seen a similar result? I ask because no matter how ‘carefully’ I run, the Garmin 955 still says I’m bobbing up and down like pogo stick!
-
Have any other SHRB2 users, that are in a position to compare with wrist based data, seen a similar result?
I found the same. Garmin (Epix Pro and Fenix 8 in my case) gives a bit more than the HRM2. It is 8.x vs. 7.x cm in an easy steady run for me. Hard to say what is closer to the truth…




Hello! It looks like you're interested in this conversation, but you don't have an account yet.
Getting fed up of having to scroll through the same posts each visit? When you register for an account, you'll always come back to exactly where you were before, and choose to be notified of new replies (either via email, or push notification). You'll also be able to save bookmarks and upvote posts to show your appreciation to other community members.
With your input, this post could be even better 💗
Register Login