Suunto SHRB2 Firmware 3.2.6.8 Update
-
My contribution from a very short test run today.
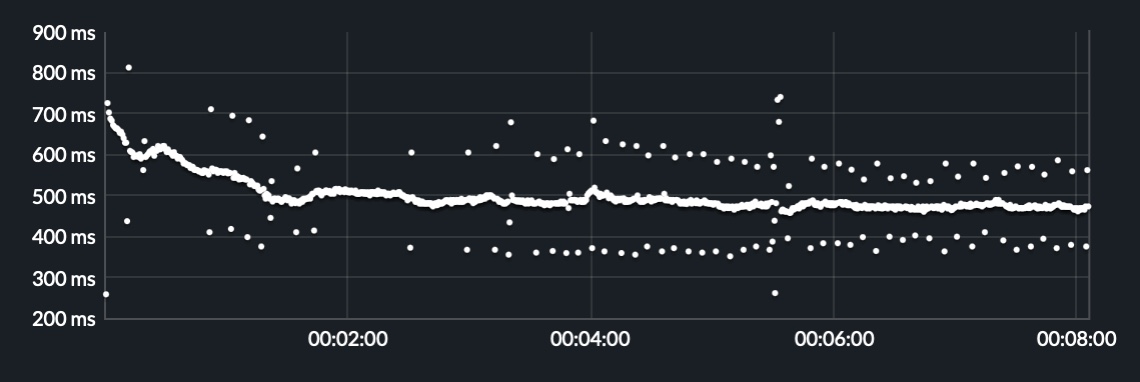
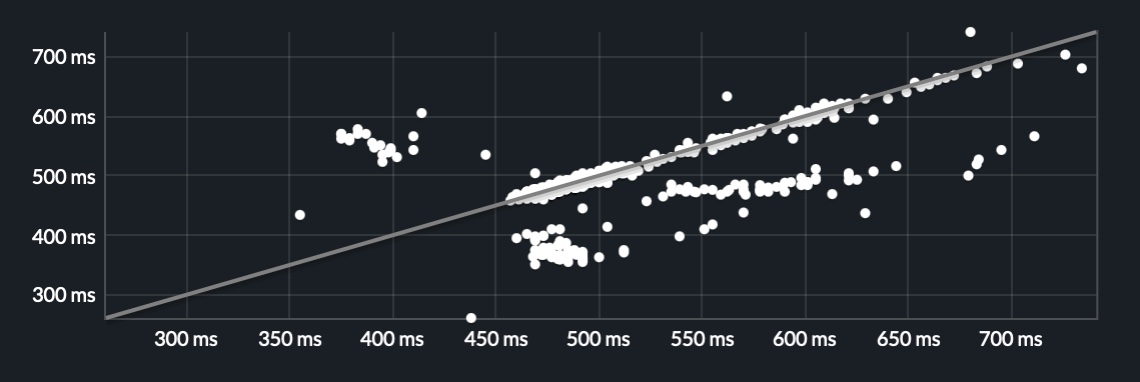
Running top is 97% Polyester.
-
@matram Now thats a strange pattern
-
And a run from later today. This run is with an IceBreaker 200, Merino Wool, top. It does not seem to improve things.
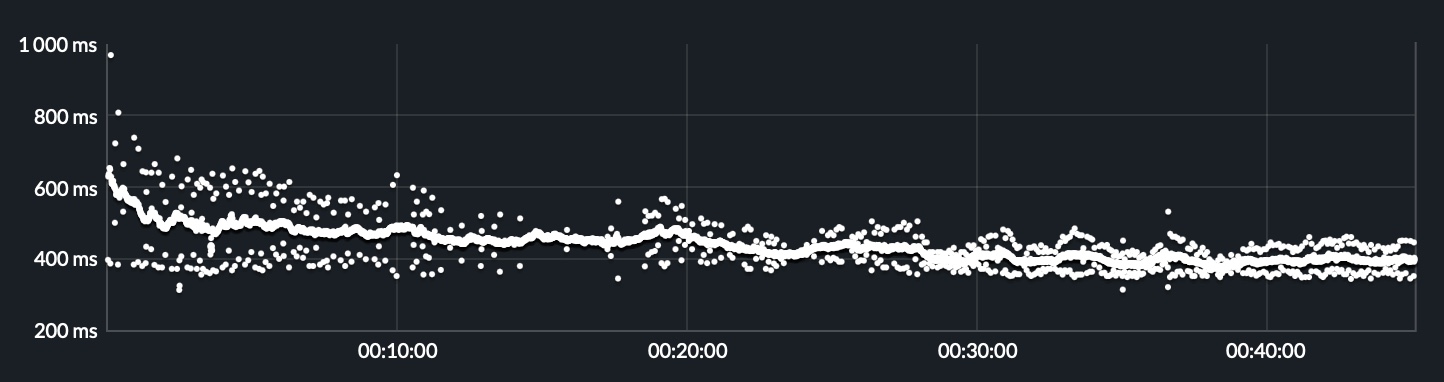
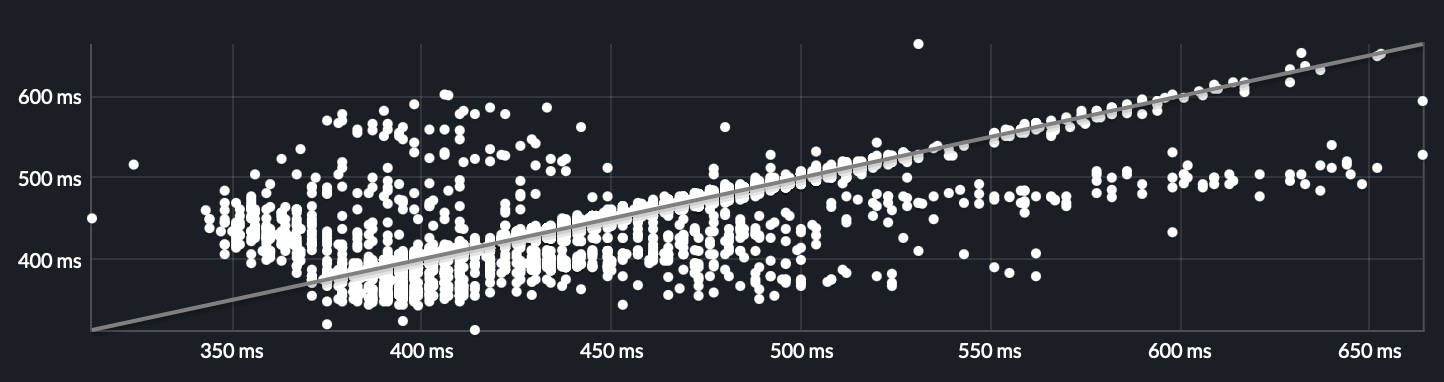
The watch is a Race 2, and Stryd Duo pods are synced as foot pods.
-
@matram Very strange. From what I’ve seen of your previous posts regarding the SHRM2, you usually have good data from the unit (judging by hearsay; think this is the first screenshot you post).
My first thought went to the old Suunto pod (Smart Heart Rate Belt ‘version 1’) where I discovered “fuzzy ‘ripple’ or ‘echo’ areas” when the module was snapped on upside down:
Suunto Smart HR Belt - Beware module orientation - HRV and ZoneSense
https://forum.suunto.com/topic/13372/suunto-smart-hr-belt-beware-module-orientation-hrv-and-zonesense/9But, I’ve tested the reverse orientation with the SHRM2 as well, on a short 1 km run, and got perfectly valid HRV data…
Very strange.
-
@Inge-Nallsson
I have been focused on running efficiency and running dynamics with SHRB2.I think HR traces looks OK compared to my Polar H10.
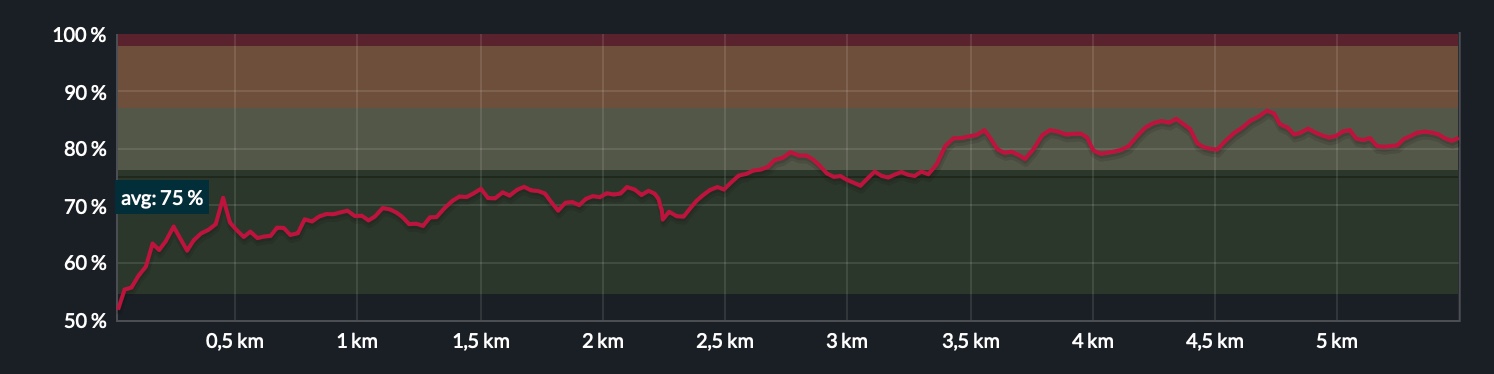
I do not really use R-R values or ZoneSense. So any issue that affects only R-R and derived metrics is not a big concern for me.
With regard to running dynamics. I think SHRB2 is a big improvement over the watch but Stryd is generally more accurate and responsive and is what I now use for running form improvements.
Of course if the underlying issue is one of ESD, that is something Suunto needs to address urgently.
-
@matram This doesn’t look sooo bad, because you have a visible line. Real bad grapghs have desolved curves, more like clouds of dots.
-
This is an outdoor rock-climbing session, during which the SHRM2 was subjected to a lot of stress. I’d say the result is satisfactory.

zoom in the 6:20–8:00 interval, a few hitches

ditto for 13:20-16:00

same setup: lcebreaker Tech Lite shirt + chest strap wet
-
@VoiGAS
I asked Claude to analyse some recent runs. Claude’s key points …The pattern is an early detection of a Heart Beat followed by a longer R-R for the following beat where the sum of two beats is accurate, so the problem is not likely to affect HR.
Early incorrect detection of a Heart Beat could be caused by ESD or poor belt contact.
For today’s longer run, the problem appears to go away after 12 min when running with Merino Wool. Which could indicate a problem with electrode wetness, maybe in combination with weather conditions.
For today’s run with SHRB2 there were 4.6% faulty beats. This is likely on the boundary when run-based DFA and HRV computations will no longer be accurate.
We did find one recent run with the Polar H10 which had 2.8% faulty beats. And many earlier runs with <0.5% faulty beats.
-
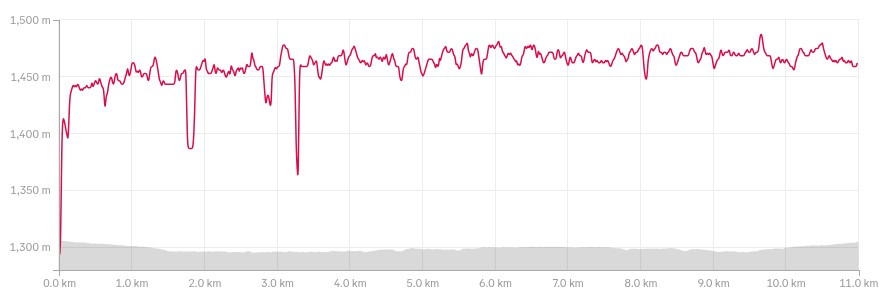
@matram Except when there is bad R-R data, there is bad HR bpm data. Due to the R-R noise, I have bpm drops. Here’s my HR bpm data from the same run where I shared the previous R-R intervals. Whenever I have R-R noise, I have bpm drops.
-
@Dimitrios-Kanellopoulos I can’t find the option to display the R-R graph. Could you please tell me where I can find it?
-
@Speed-Man it should be tehre if the activity has RR do you have a link for me so I can help and check ?
Community Manager / Admin @Suunto
Creator of quantified-self.io
-
What amount of artifacts (%) is the limit for a good measurement?
Suunto Race 2, Edge 530, Suunto Wings, Polar H10&Verity Sense, Suunto Smart Belt
-
@Maryn there will awlays be artifacts with belts. And not all libs do the same parsing.
So you need to establish the baseline in a way
Community Manager / Admin @Suunto
Creator of quantified-self.io
-
@Dimitrios-Kanellopoulos https://quantified-self.io/user/Wn5k7NdDxrWRF578c9IxeLgywVB2/event/9396ac60cdc1f02c7999c0c580e248acdd389ad3eccd4950ff68664e32a77154
-
@Maryn said in Suunto SHRB2 Firmware 3.2.6.8 Update:
What amount of artifacts (%) is the limit for a good measurement?
When I asked AI - the response was 3-5% for a DFA-a1 or HRV computation.
Maybe the time has come for an official response from Suunto?
-
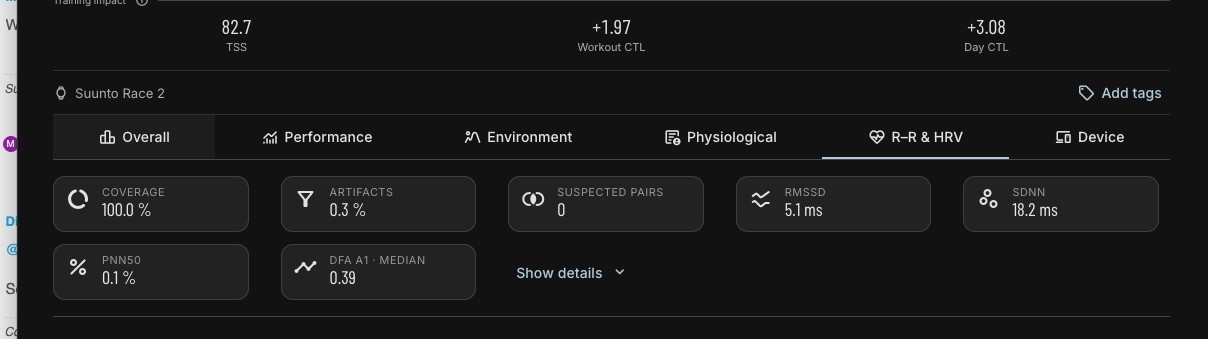
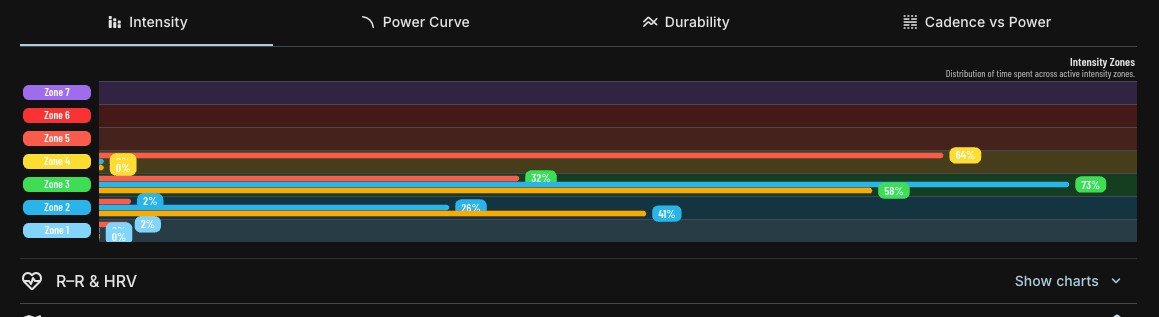
@Speed-Man check under RR and HRV both on the summaries and just above the charts Screenshot 2026-10-30 at 10.56.48
 Screenshot 2026-10-30 at 10.56.43
Community Manager / Admin @Suunto
Creator of quantified-self.io
-
@Dimitrios-Kanellopoulos Yes, there will always be artifacts. My question is more about what percentage can be considered a good measurement, acceptable, for example, in terms of Zone Sense.
I used to have a lot of artifacts, and that was the reason I had to replace just the strap on my Suunto sensor. Since then, I’ve been getting results in the 0-1% range. -
@Dimitrios-Kanellopoulos Can I view the data in a graph? I’ve been trying to find that option, but I can’t seem to locate it.

-
@Speed-Man jsut press the hrv-rr button bro see my pic. The show charts button
Community Manager / Admin @Suunto
Creator of quantified-self.io
-
@Dimitrios-Kanellopoulos I got it working now. Thank you very much!







Hello! It looks like you're interested in this conversation, but you don't have an account yet.
Getting fed up of having to scroll through the same posts each visit? When you register for an account, you'll always come back to exactly where you were before, and choose to be notified of new replies (either via email, or push notification). You'll also be able to save bookmarks and upvote posts to show your appreciation to other community members.
With your input, this post could be even better 💗
Register Login