Suunto ZoneSense
-
@kriskus and others,
i noted the same, and i would love to understand how to use it (if usable )
)
there was here https://forum.suunto.com/post/155245 this mention about a 3min window.
Might we consider that ZS is indicating the past 3min reflect of our effort ? -
@halajos I have climb enabled, but before zone sens I’ve had also 2 S+ apps active. I don’t think that climb should interfere with ZS (?)
-
@Mff73 Well, in my case it would probably be a little more. Each interval was around 5’ long and ZS only starts rising just before the 3’ pause. It looks just as if it was somewhat shifted vs HR.
-
@kriskus Looks you have problems to reach the red zone - me too. Made a 3/9 minute FTP test today. In the All Out sections I thought I would spit my lungs out, but nothing red in Zonesense and also no VO2MAX threshold as I didn’t cross it

-
@kriskus such long delay is odd, haven’t seen that in my use of ZoneSense. 1200m reps almost fall in the short side for ZS to represent the accumulated fatigue but should be doable. In my experience, when talking intervals, about 800 meters in, it starts to show realistic effort levels. BTW it’s also known/expected that after quick changes of pace (from jogging to start of interval) ZS will drop to low green and then start going up as rep progresses.
Looks like your baseline collection (first 10 mins) were done in yellow already, recommendation is to go easy on those 10 initial mins, mostly aerobic to get a good baseline, when effort increases, it’s going to be compared against o that baseline if it was captured at all, otherwise previous day(s) captured baseline.
-
@VoiGAS try a medium speed 30 min run to reach base exhaustion and then slowly but steadily push towards limit for as long as you can.
-
@herlas Well, the first ~2kms were in fact a warm-up, and all done in the green zone. My HR zones were set up after a performance test, though it’s been a while now and they might need light adjustment.
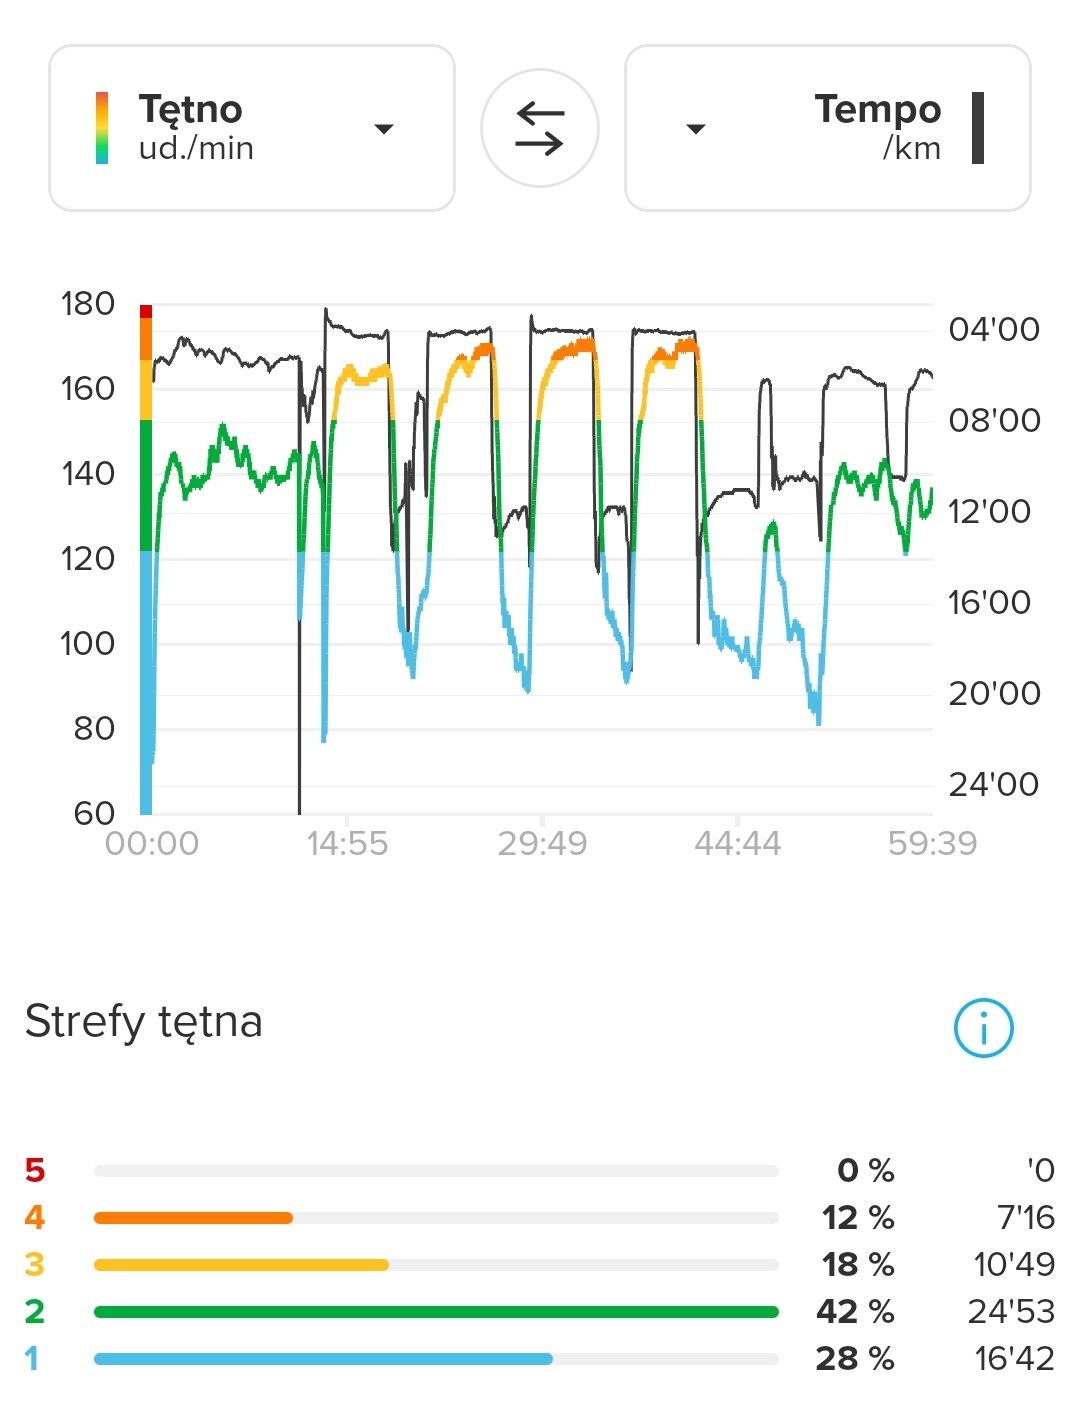
-
@VoiGAS Actually, today’s run wasn’t meant to get to the red zone. Recently I did a treadmill run to get to my max and I reached the red zone in the end:
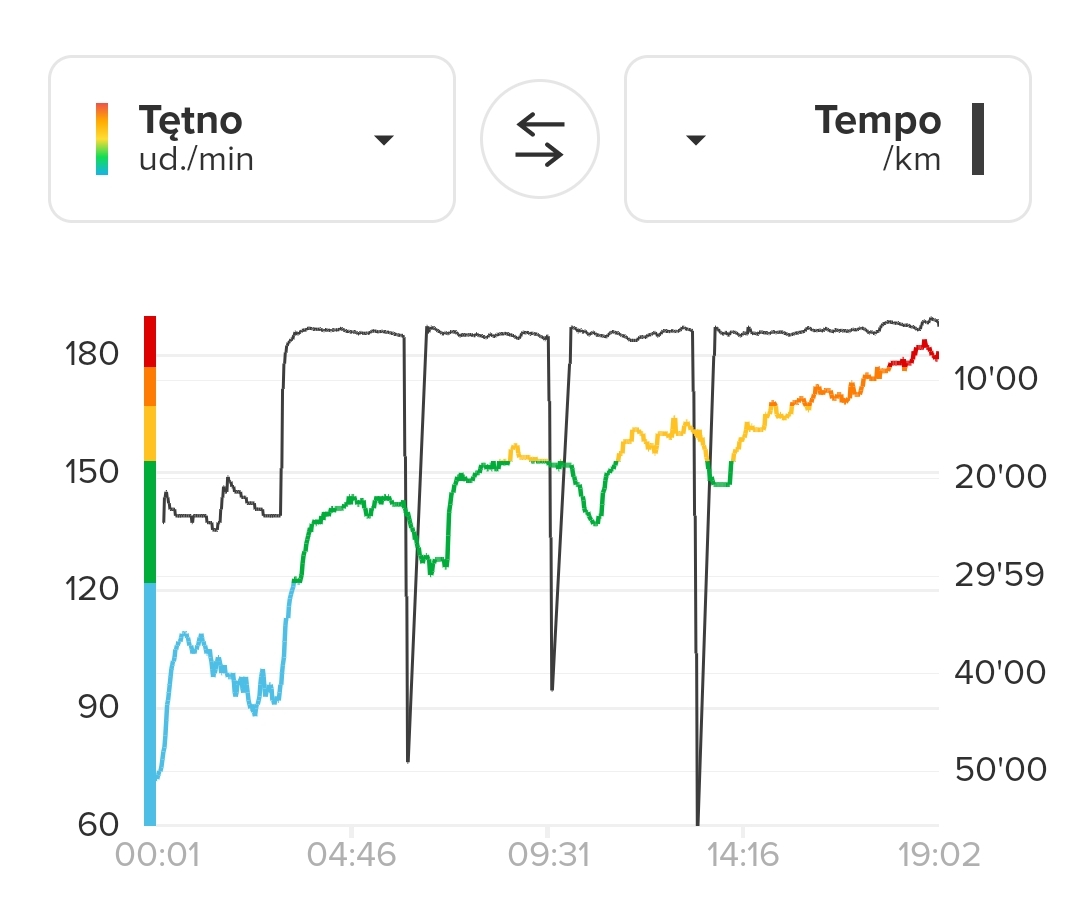
-
@kriskus 10 min warmup in green according to your current HR zones, I was talking about your ZoneSense data clearly shows it was yellow, so probably a tad quicker than the aerobic recommended warmup for ZS.
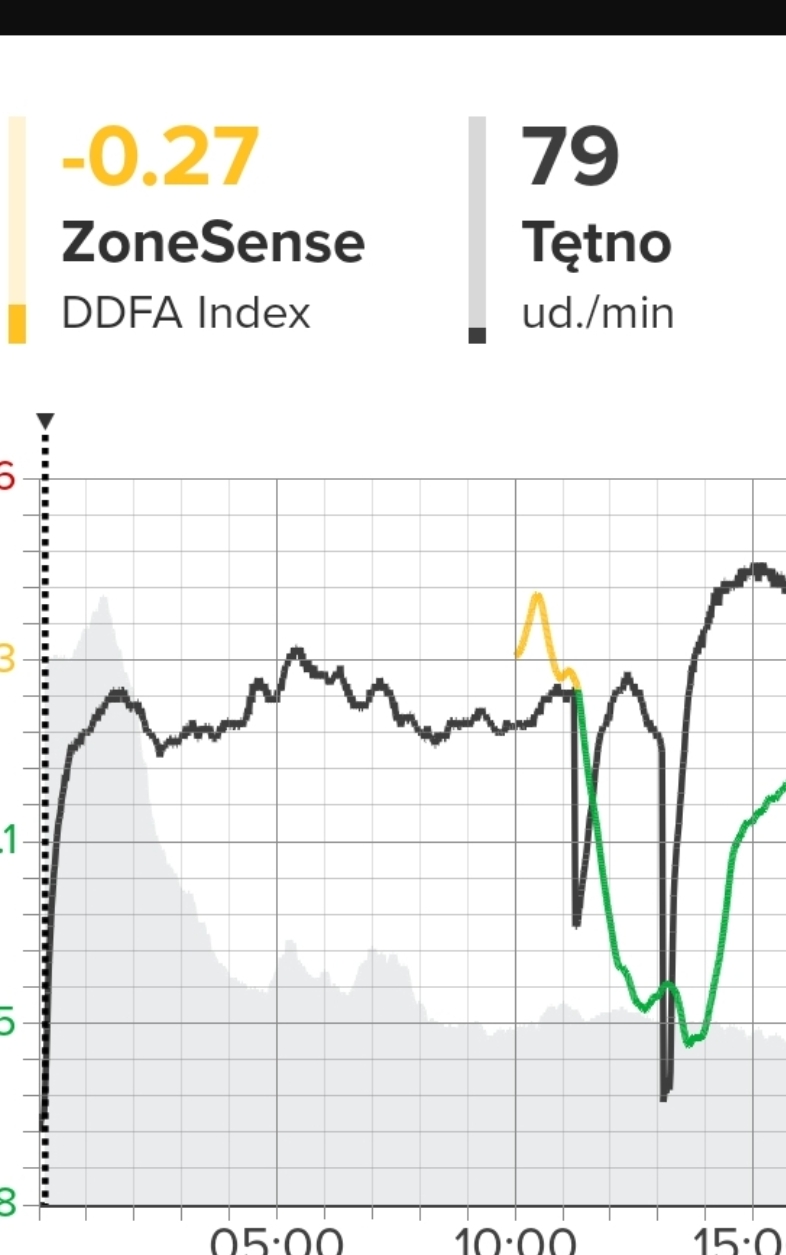
-
@Mff73 said in Suunto ZoneSense:
@kriskus and others,
i noted the same, and i would love to understand how to use it (if usable )
)
there was here https://forum.suunto.com/post/155245 this mention about a 3min window.
Might we consider that ZS is indicating the past 3min reflect of our effort ?I’ve read the whitepaper and as far as I understood the calculation is based on various buckets of R-R intervals, with bucket sizes between 5…64 R-R intervals. This means the current DDFA index is calculated based on about the last 20…60 seconds of R-R data depending on the HR.
-
@halajos said in Suunto ZoneSense:
@Mff73 said in Suunto ZoneSense:
@kriskus and others,
i noted the same, and i would love to understand how to use it (if usable )
)
there was here https://forum.suunto.com/post/155245 this mention about a 3min window.
Might we consider that ZS is indicating the past 3min reflect of our effort ?I’ve read the whitepaper and as far as I understood the calculation is based on various buckets of R-R intervals, with bucket sizes between 5…64 R-R intervals. This means the current DDFA index is calculated based on about the last 20…60 seconds of R-R data depending on the HR.
You are both right:
There is the Zonesense sampling rate, but more so your body. Zonesense is relying on a somewhat stable condition of your cardiovascular system. This is where the 3 mins come from. Quick changes in effort or power cannot be measured with a sampling rate of 0.5-1min.Google sampling rate.
-
@Egika, now we can speak.
The need for stable cardiovascular condition and the too slow sample rate, in addition to the first minutes where it calibrates, mean that ZoneSense can be a good test to determine zones, threshold etc, where the person to be tested is given instructions on what to do and how to structure his/her efforts.
For normal efforts like training, racing, free riding etc it seems a very unstable metric where you can draw no conclusion on what your heart/body is doing.
-
@mlakis it depends on the kind of training or race. If it is of endurance type >10km run or >1h duration, ZoneSense is a super valuable tool to keep your effort in the aerobic zone. HR zones can be off as they differ from day to day.
This is where the new technology really shines!
For my Sunday morning 5k run it is not useful. -
I have watched the videos about ZoneSense and read many articles about the connections from a medical point of view. A very complex matter and a great, interesting project from Suunto!
After some tests (several trainings of several sports on several days) I can say for my use that there are clear differences.
For workouts such as running or kick biking, which tend to be in the higher heart rate range and where I don’t pause to take photos, ZoneSense seems to deliver comprehensible results.
The same applies to cycling, but only on the fast bike without interruptions and often on the mountain bike during long uphills. Changing conditions such as long descents or interruptions often seem to influence ZoneSense and produce incomprehensible results in the live display.
The live display also differs from the display in the app after training. I often have the short display in the VO2max range on the watch, which does not appear at all in the analysis. The time delay in the display seems to play a role here.
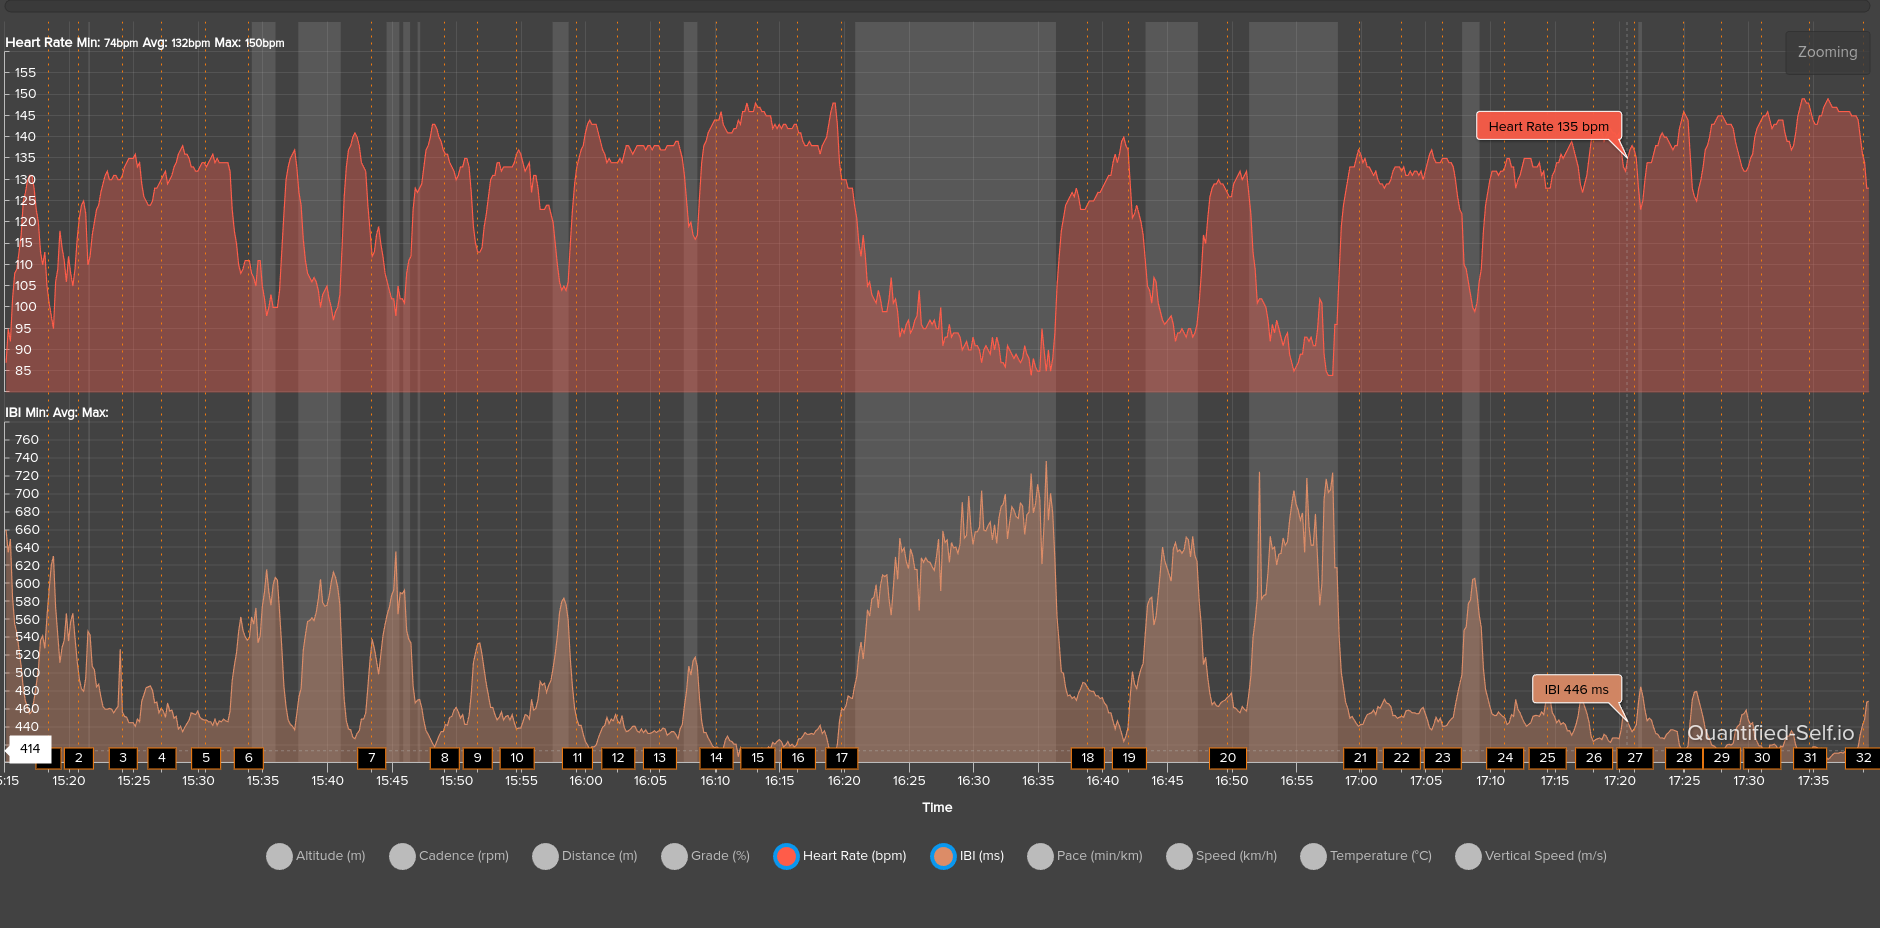
The Polar H10 data source provides correct data, which is also displayed correctly in the Suunto fit file. Here, however, the IBI value (interbeat interval) is displayed as HRV, not the actual HRV.
Quantified Self also displays the IBI values correctly and shows the correlation with the heart rate (I am attaching a screenshot and a correlating screenshot showing ZoneSense and heart rate from Suunto app). The HRV is not displayed and would have to be calculated separately from the FIT file.
This is my personal experience with ZoneSense. An interesting function that provides additional insights into daily training and is certainly an interesting addition to training for real athletes.
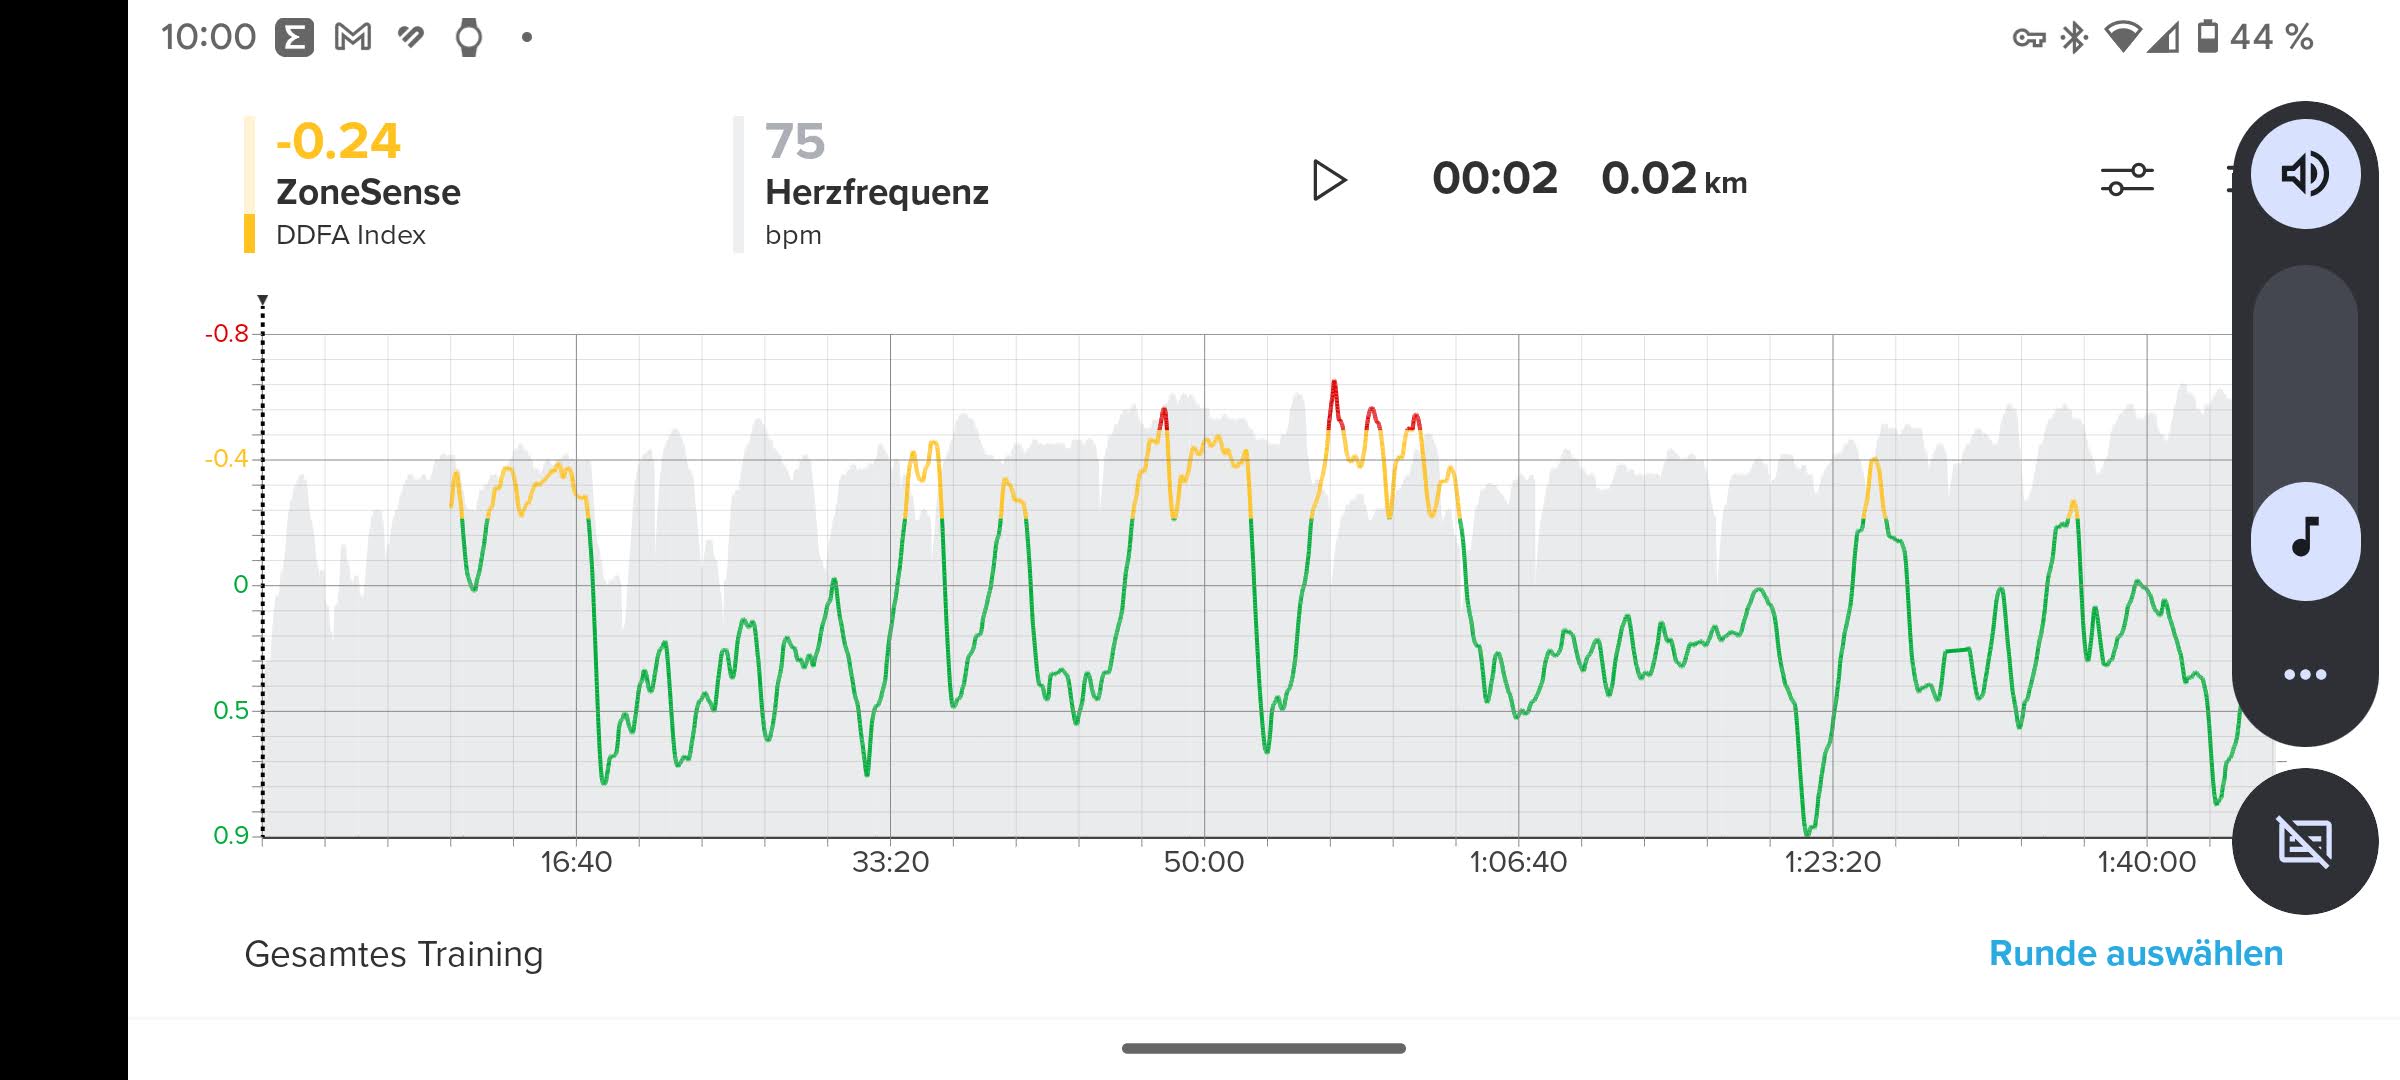
-
@pilleus A bit off topic: I haven’t opened QS in a while and I was not aware of the IBI chart. Where can I find some guidance on how to read it?
-
@Francesco-Pagano said in Suunto ZoneSense:
@pilleus A bit off topic: I haven’t opened QS in a while and I was not aware of the IBI chart. Where can I find some guidance on how to read it?
Import your training from Suunto to QS and you will find in the charts section the IBI chart (klick to activate it). To avoid the auto stops you can choose distance as x axis type.
-
@halajos said in Suunto ZoneSense:
@droopsio do you have any other Suunto+ activated or intensity target set? I had issues with ZoneSense when I tried to use different features at the same time.
@halajos you was right - after I’ve switched off climb in S+, ZoneSense started to work as it should. I still don’t why there may be a problem, but it seems, that 2 apps running at the same time are too much for the watch

-
@droopsio I hope this will be fixed, looks like a problem with the S+ framework
-
@pilleus said in Suunto ZoneSense:
Import your training from Suunto to QS
Without QS you can convert your Suunto fit file into a csv file and plot the hr and ibi data into a chart, where you can see the corralation of both charts (the misreadings can be seen clearly).
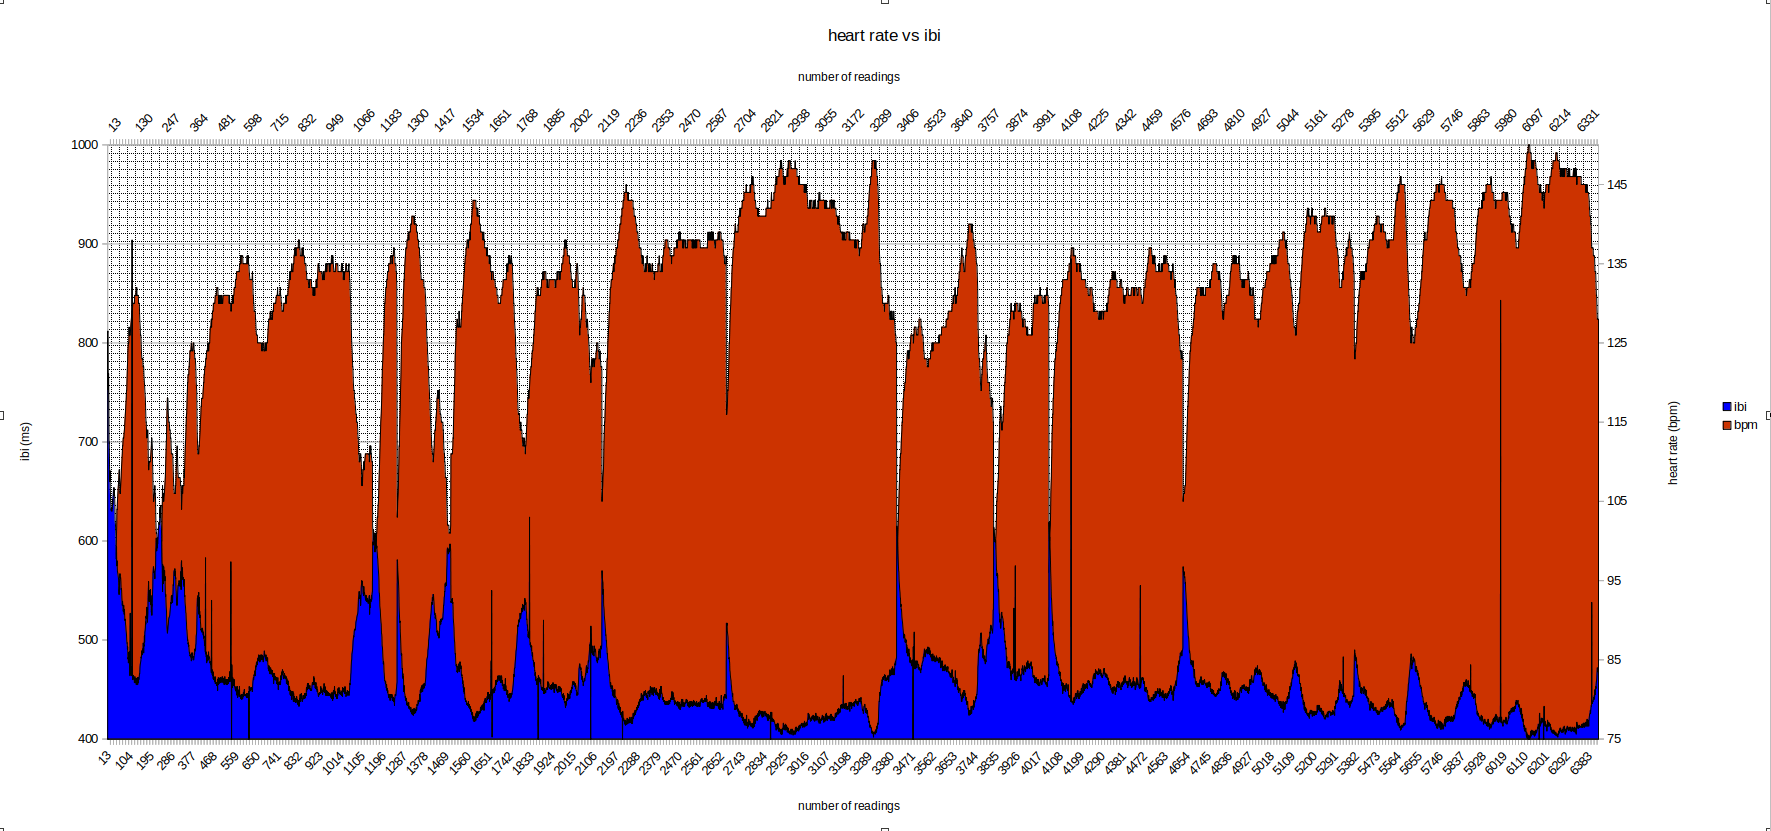
-
@Egika, it’s good that Suunto is pairing with group of scientists to provide new insights using the data we capture with our watches.
Haven’t read the paper, but in practise, it seems that ZS could be a very good structured test with instructions in the fashion of “in the warm-up do this, then ramp efforts like this etc”, like tests that use blood sampling, only that you can get the same results as a laboratory but without the lab and the blood sampling.
This is a huge innovation.
But the usage of ZS as a metric on totally uncontrolled environment during the activities (and post-workout on SA), for me (and for many others), is totally unintuitive and unstable.
To conclude, I think that ZS will give more value to a lot more people if it can be coupled with some structured test or at least structured instructions for us to do, and with the results we can update our zones, either a 5 or a 3 zone model.