7-day HRV average on "Recovery HRV" widget
-
Hi all,
@moderators : this question relates to my new Suunto Race (love it !), but if I got it right, the software part is common to several watches, hence my post in “Watches”. Feel free to move this anywhere it fits better
")
I’m puzzled about the way informations are displayed by the “Recovery HRV” widget (on the watch, not on the app), my question is mostly about the user interface than the values themselves.
The widget displays :
- in the center of the screen, in large + bold digits : my 7-day average (this value is also shown on the circular graph)
- under it : the “normal range”, [31-37] on my watch
- at the bottom, in smaller digits : my “last night” value
-
where do the values of the “normal range” come from ? Are these computed from my history of values ? Or are they common values for my gender + age + weight + … ? I’ve read in various articles (including some from Suunto) that there is no such “normal value” for HRV, and what matters most is not really the value itself but how it evolves from day to day. What’s the point of displaying any “normal value” ?
-
given that the HRV value follows the current stress/recovery status, what’s the point of highlighting the 7-day average vs the “last night” measure ? Doesn’t an average value conceal spikes and dips while the really interesting information is the current status (i.e. latest HRV measure) ?
Cheers
MatthieuSuunto Race Titanium : FW 2.37.34
Suunto App : 4.97.7 on Android 14
Suunto Ambit3 Peak : FW 2.4.17
SuuntoLink 3.5.2 on Windows 10 -
@Matthieu-Fou said in 7-day HRV average on "Recovery HRV" widget:
- where do the values of the “normal range” come from ? Are these computed from my history of values ? Or are they common values for my gender + age + weight + … ? I’ve read in various articles (including some from Suunto) that there is no such “normal value” for HRV, and what matters most is not really the value itself but how it evolves from day to day. What’s the point of displaying any “normal value” ?
Your normal range is just a long average of your values. If your measurements move away too fast from the average, there may be something (good or bad) different.
-
- where do the values of the “normal range” come from ? Are these computed from my history of values ? Or are they common values for my gender + age + weight + … ? I’ve read in various articles (including some from Suunto) that there is no such “normal value” for HRV, and what matters most is not really the value itself but how it evolves from day to day. What’s the point of displaying any “normal value” ?
Normal range is entirely based on your history of values, the rolling previous 60 days of them once you get enough.
- given that the HRV value follows the current stress/recovery status, what’s the point of highlighting the 7-day average vs the “last night” measure ? Doesn’t an average value conceal spikes and dips while the really interesting information is the current status (i.e. latest HRV measure) ?
What’s interesting is both, arguably. Your seven day vs your six week shows if you’re out of your normal zone, wither above or below, due to detraining/sickness/overtraining/stress etc. The one day shows the events of yesterday on you, which whilst interesting, if it trends over 2/3 days towards a week without reason is more worrying - hence the 7-day average highlight.
They could have gone with fewer days sure, but I guess this is what we get.
-
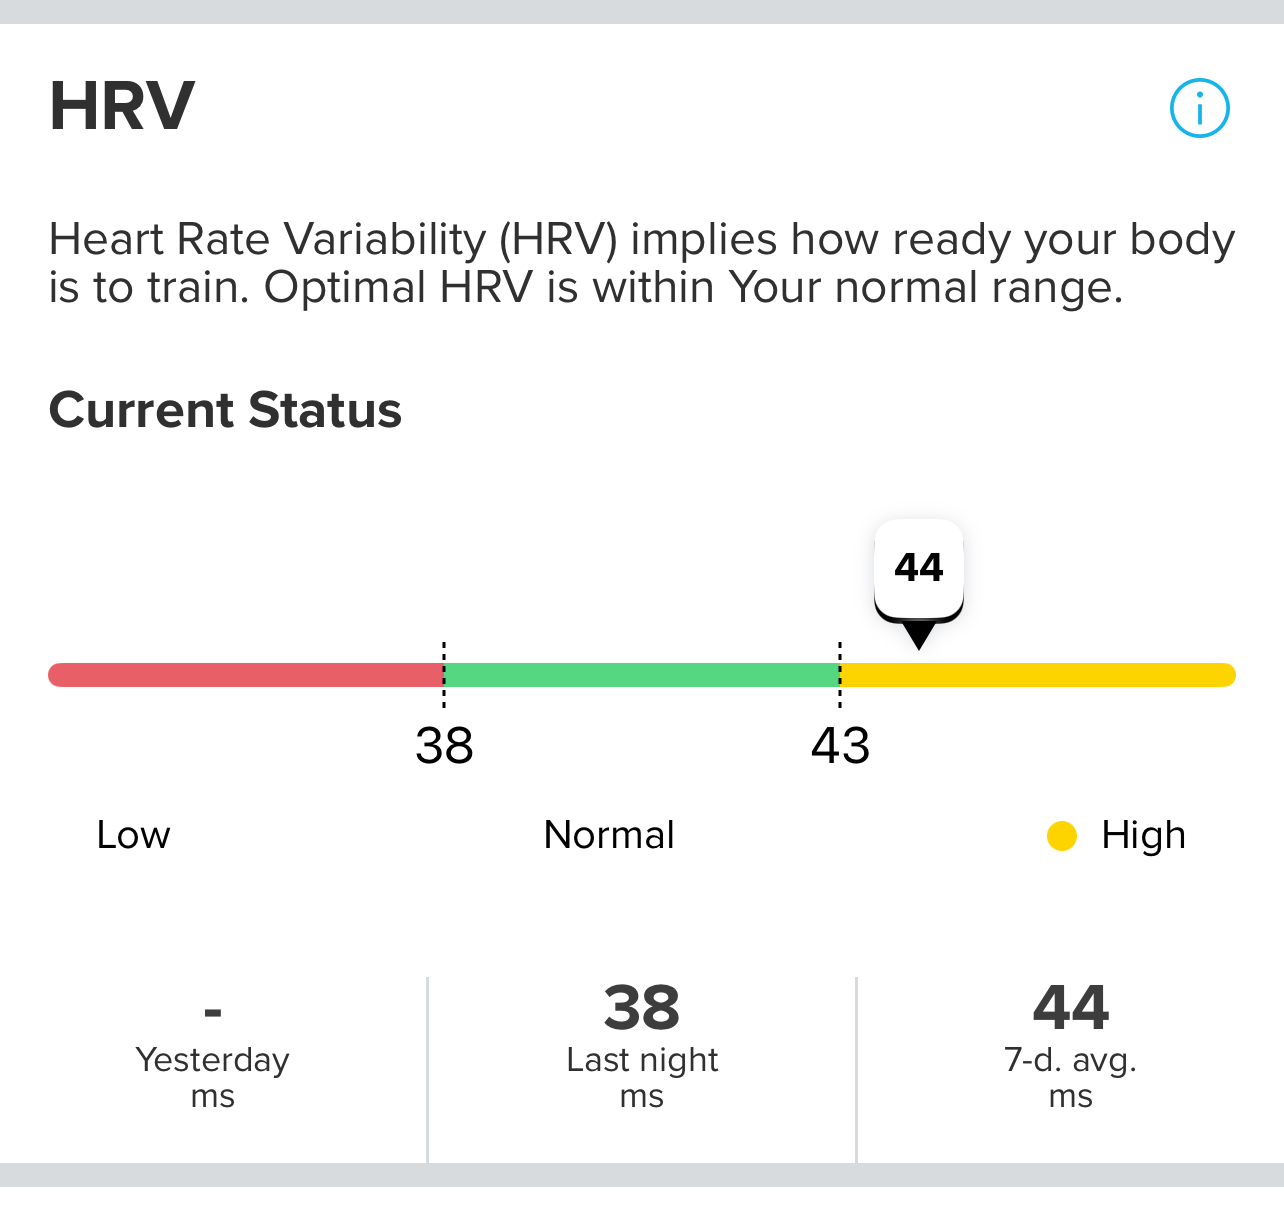
I don’t want to open a new topic, but not sure if it’s related to the latest update, or I am just remembering that the HRV used to be displayed differently. My last nights HRV was 38, but instead of showing 38 on the graph, it shows the 7 day average - 44. Was this always like this? Or I am just not remembering it right? I remember it showing my last nights value on the graph - not the 7 d.avg. Can someone advise on this? Thanks!
 /var/folders/xf/hmh7xdpj67lfspqw0mwl_00c0000gn/T/com.apple.useractivityd/shared-pasteboard/items/181A9DC0-8CE2-4999-9BA0-9C3BC17BCB49/IMG_4386.jpeg
 -
@timecode said in 7-day HRV average on "Recovery HRV" widget:
I don’t want to open a new topic, but not sure if it’s related to the latest update, or I am just remembering that the HRV used to be displayed differently. My last nights HRV was 38, but instead of showing 38 on the graph, it shows the 7 day average - 44. Was this always like this? Or I am just not remembering it right? I remember it showing my last nights value on the graph - not the 7 d.avg. Can someone advise on this? Thanks!
/var/folders/xf/hmh7xdpj67lfspqw0mwl_00c0000gn/T/com.apple.useractivityd/shared-pasteboard/items/181A9DC0-8CE2-4999-9BA0-9C3BC17BCB49/IMG_4386.jpegThe 7day avg HRV is shown in the Graph. The last Night is written under the Graph.